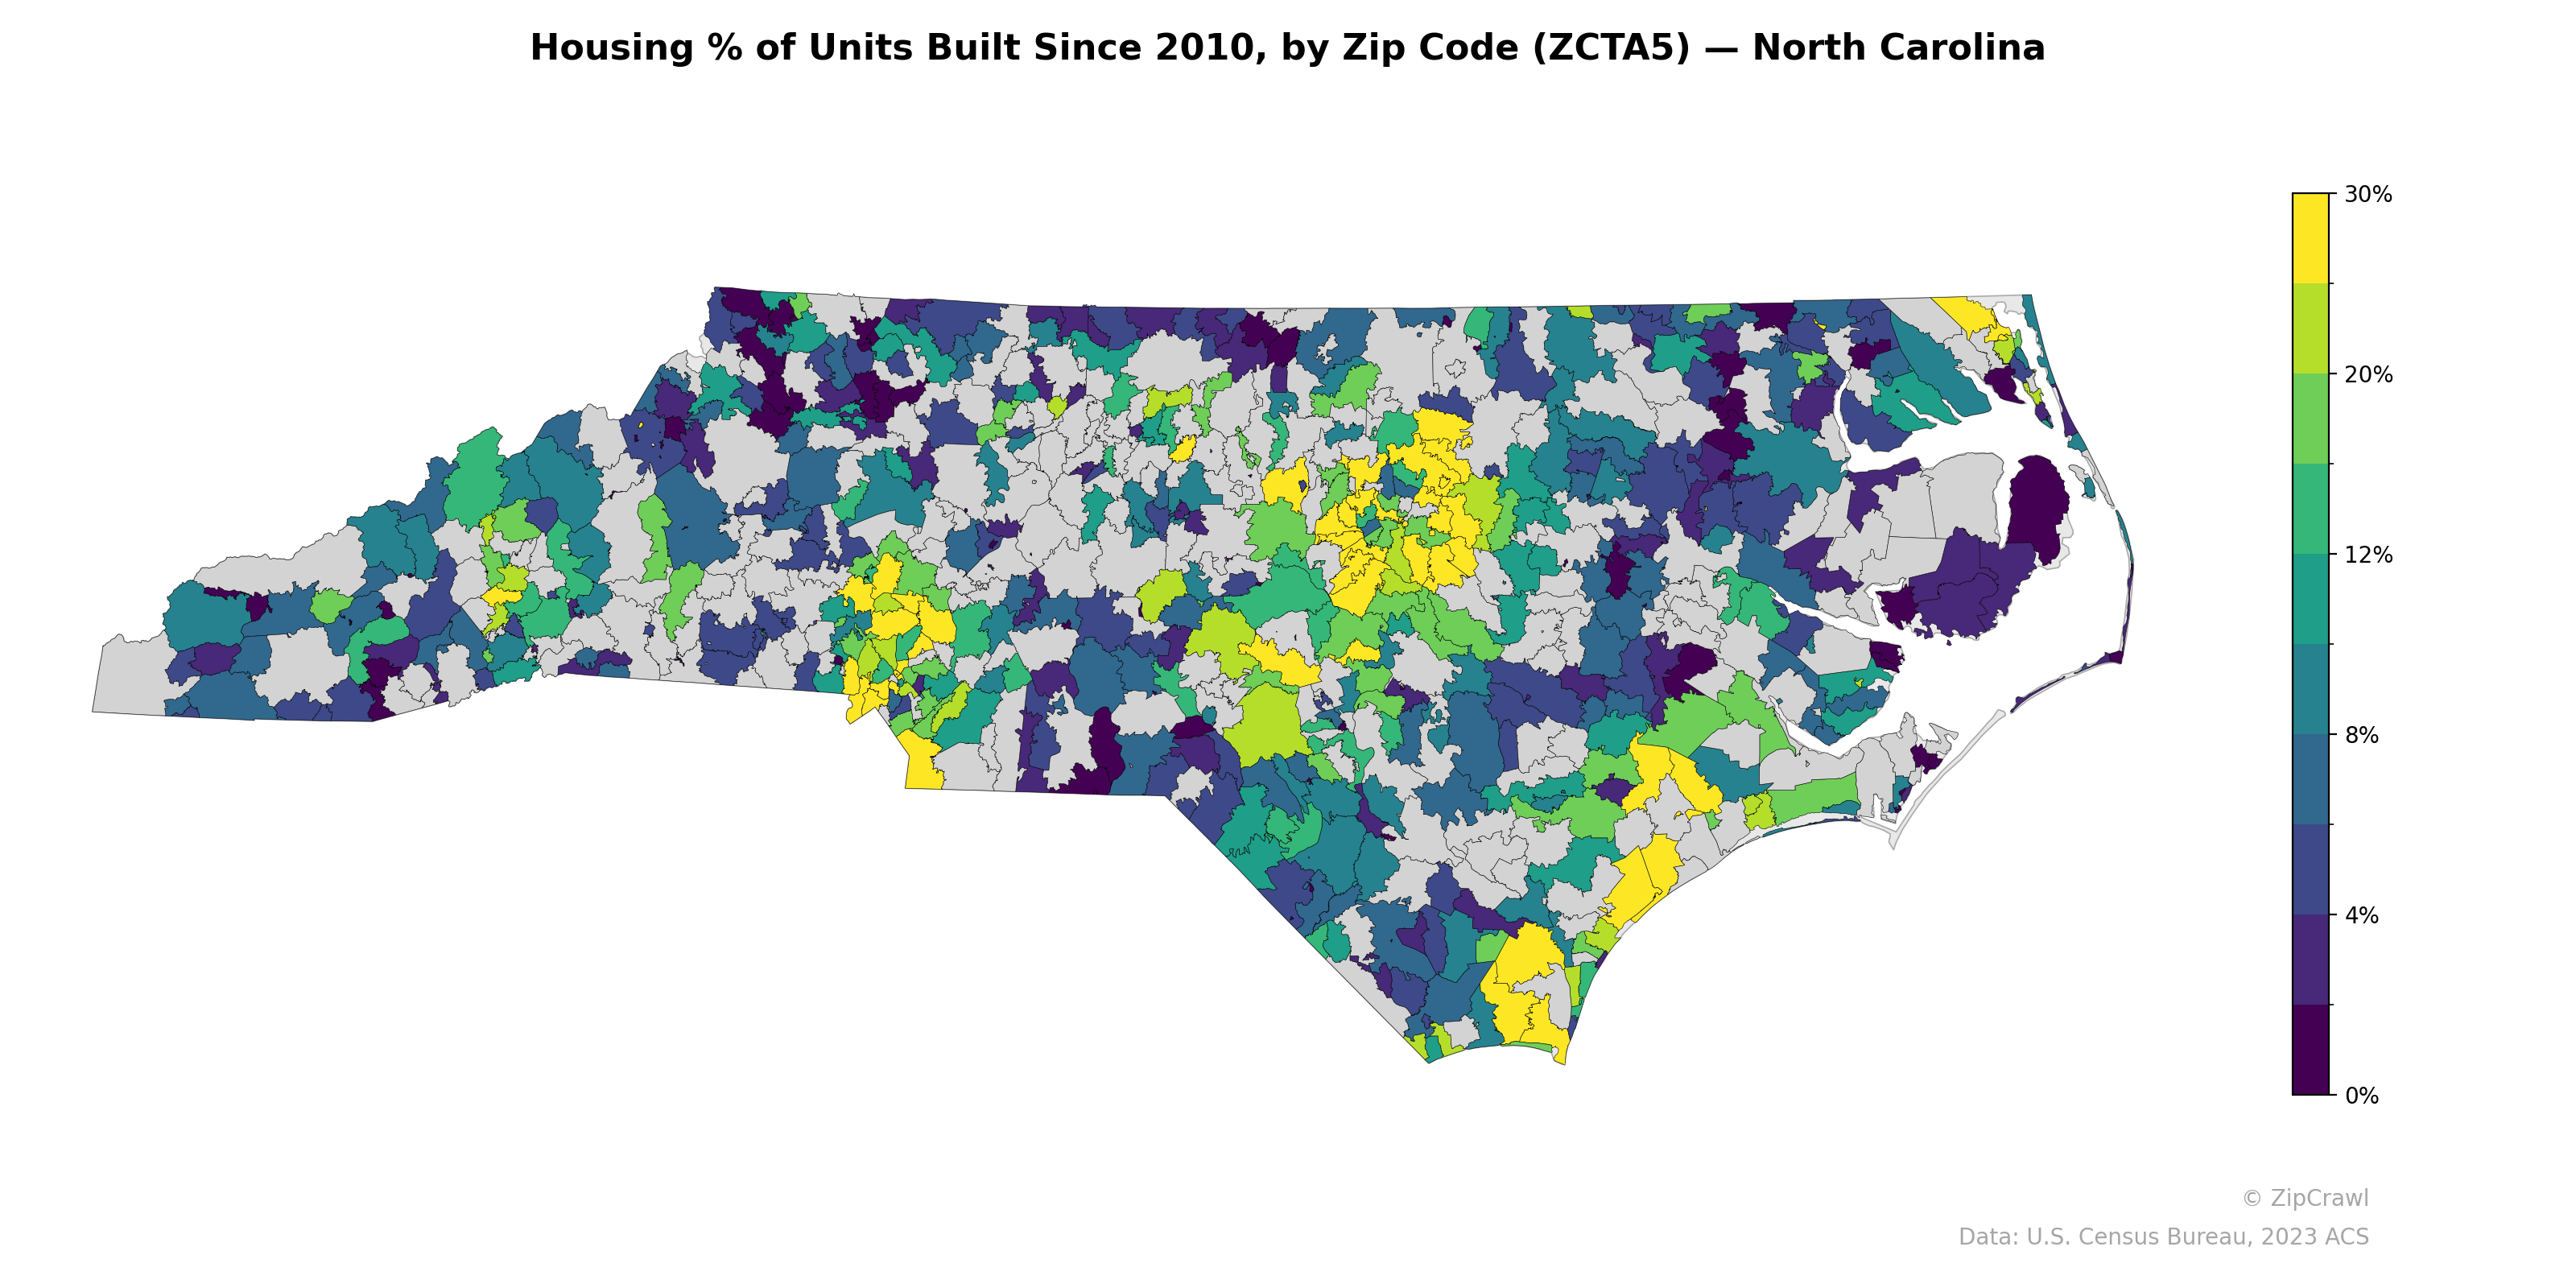
NOTE: Gray indicates insufficient data or a suppressed estimate.
The highest concentrations of post-2010 housing construction cluster around the Charlotte metropolitan area in the southwest, the Research Triangle region (Raleigh-Durham-Chapel Hill) in the central Piedmont, and several coastal communities near Wilmington and Brunswick County, where yellow shading indicates 25–30%+ of housing stock built since 2010. In contrast, rural zip codes across the northeastern Coastal Plain, parts of the western mountains, and the central Sandhills region consistently show very low new construction rates below 4%, reflecting slower population growth and limited development pressure. The gray (no-data) zip codes scattered throughout the state's rural interior further underscore the uneven distribution of residential development activity across North Carolina.
Data: U.S. Census Bureau, 2023 ACS
Explore
- Housing Owner-Occupied % of Units, by Zip Code (ZCTA5) — North Carolina
- Housing Owner-Occupied Median Value ($), by Zip Code (ZCTA5) — North Carolina
- % of Population without Health Insurance, by Zip Code (ZCTA5) — North Carolina
- Housing Median Monthly Rent ($), by Zip Code (ZCTA5) — North Carolina
- Household Average Size by Zip Code (ZCTA5) — North Carolina
- Housing Vacancy Rate by Zip Code (ZCTA5) — North Carolina
- % of Households with Broadband Internet, by Zip Code (ZCTA5) — North Carolina
- Bachelor's Degree or Higher (% of Over 25) by Zip Code (ZCTA5) — North Carolina
- Married Couple (% of all Households) by Zip Code (ZCTA5) — North Carolina
- Median Age by Zip Code (ZCTA5) — Kansas
- Population Non-Hispanic White % by County
- % of Population without Health Insurance, by Zip Code (ZCTA5) — New York Metro
- Population Non-Hispanic Asian % by Zip Code (ZCTA5) — New York Metro
- Household Average Size by Zip Code (ZCTA5) — New York Metro
- % of Households with Broadband Internet, by Zip Code (ZCTA5) — New York Metro
- Married Couple (% of all Households) by County
- Housing Vacancy Rate by Zip Code (ZCTA5) — New York Metro
- Housing Median Monthly Rent ($), by Zip Code (ZCTA5) — New York Metro
- Housing Owner-Occupied Median Value ($), by Zip Code (ZCTA5) — New York Metro
- Married Couple (% of all Households) by Zip Code (ZCTA5) — New York Metro
- High School Graduate (% of Over 25) by Zip Code (ZCTA5) — North Carolina
- Population Non-Hispanic Black % by Zip Code (ZCTA5) — North Carolina
- Population Non-Hispanic American Indian % by Zip Code (ZCTA5) — North Carolina
- Population Non-Hispanic Asian % by Zip Code (ZCTA5) — North Carolina
- Household Median Income by Zip Code (ZCTA5) — North Carolina
- U.S. Citizens (% of Population Over 18) by Zip Code (ZCTA5) — North Carolina
- Median Age by Zip Code (ZCTA5) — North Carolina
- Population Non-Hispanic White % by Zip Code (ZCTA5) — North Carolina
- Population Hispanic % by Zip Code (ZCTA5) — North Carolina
- % of Population on Food Stamps or SNAP (Last 12 Months), by Zip Code (ZCTA5) — North Carolina
- Housing % of Units Built Since 2010, by Zip Code (ZCTA5) — South Carolina
- Housing % of Units Built Since 2010, by Zip Code (ZCTA5) — North Dakota
- Housing % of Units Built Since 2010, by Zip Code (ZCTA5) — Ohio
- Housing % of Units Built Since 2010, by Zip Code (ZCTA5) — Utah
- Housing % of Units Built Since 2010, by Zip Code (ZCTA5) — Nevada
- Housing % of Units Built Since 2010, by Zip Code (ZCTA5) — Iowa
- Housing % of Units Built Since 2010, by Zip Code (ZCTA5) — Arizona
- Housing % of Units Built Since 2010, by Zip Code (ZCTA5) — Indiana
- Housing % of Units Built Since 2010, by Zip Code (ZCTA5) — Montana
- Housing % of Units Built Since 2010, by Zip Code (ZCTA5) — Texas