NOTE: Gray indicates insufficient data or a suppressed estimate.
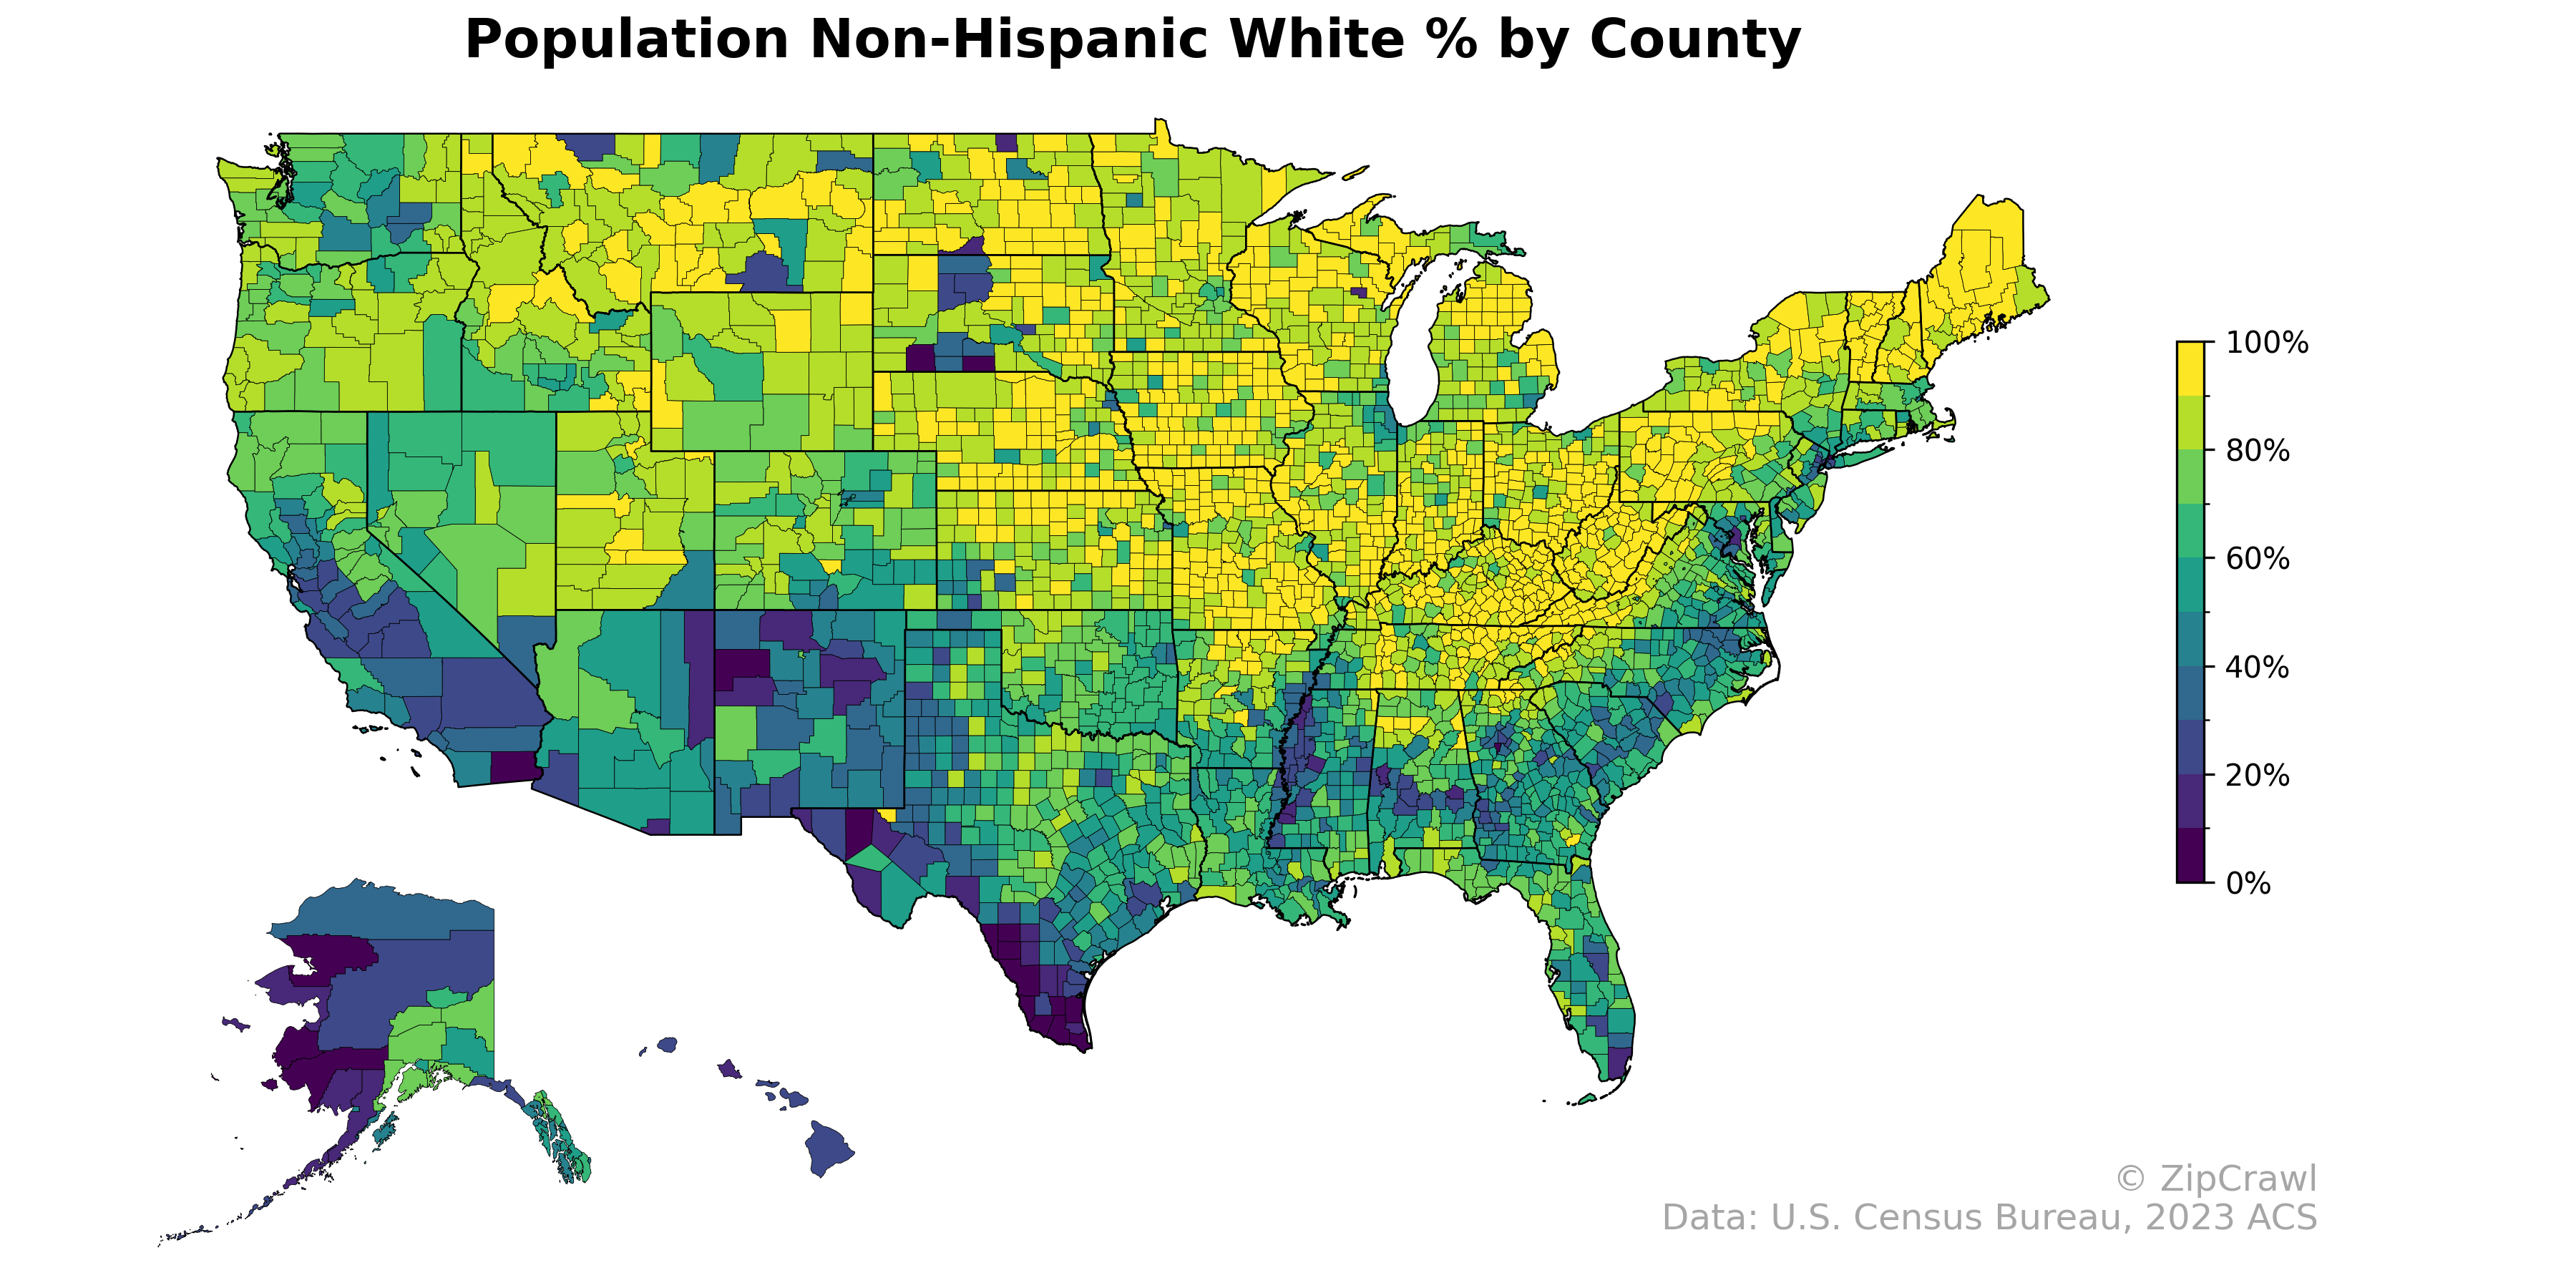
Explore the geographic distribution of non-Hispanic white populations across American counties. This map reveals stark regional patterns shaped by migration history, the Great Migration and its reversal, Hispanic immigration corridors, and the increasing diversity of major metropolitan areas versus the homogeneity of rural heartland communities.
Data: U.S. Census Bureau, 2023 ACS
Explore
- Housing Vacancy Rate by Zip Code (ZCTA5) — New York Metro
- Population Non-Hispanic Asian % by Zip Code (ZCTA5) — New York Metro
- Married Couple (% of all Households) by Zip Code (ZCTA5) — New York Metro
- Housing Median Monthly Rent ($), by Zip Code (ZCTA5) — New York Metro
- % of Households with Broadband Internet, by Zip Code (ZCTA5) — New York Metro
- Housing Owner-Occupied Median Value ($), by Zip Code (ZCTA5) — New York Metro
- Housing % of Units Built Since 2010, by Zip Code (ZCTA5) — New York Metro
- Household Average Size by Zip Code (ZCTA5) — New York Metro
- % of Population without Health Insurance, by Zip Code (ZCTA5) — New York Metro
- % of Population on Food Stamps or SNAP (Last 12 Months), by Zip Code (ZCTA5) — North Carolina
- Housing Owner-Occupied Median Value ($), by Zip Code (ZCTA5) — North Carolina
- % of Households with Broadband Internet, by Zip Code (ZCTA5) — North Carolina
- Married Couple (% of all Households) by Zip Code (ZCTA5) — North Carolina
- Population Non-Hispanic Asian % by Zip Code (ZCTA5) — North Carolina
- Housing Median Monthly Rent ($), by Zip Code (ZCTA5) — North Carolina
- U.S. Citizens (% of Population Over 18) by Zip Code (ZCTA5) — Michigan
- Population Hispanic % by Zip Code (ZCTA5) — North Carolina
- U.S. Citizens (% of Population Over 18) by Zip Code (ZCTA5) — North Carolina
- Population Non-Hispanic Black % by Zip Code (ZCTA5) — North Carolina
- Population Non-Hispanic American Indian % by Zip Code (ZCTA5) — North Carolina
- Household Median Income by Zip Code (ZCTA5) — North Carolina
- Median Age by Zip Code (ZCTA5) — North Carolina
- High School Graduate (% of Over 25) by Zip Code (ZCTA5) — North Carolina
- Bachelor's Degree or Higher (% of Over 25) by Zip Code (ZCTA5) — North Carolina
- % of Population without Health Insurance, by Zip Code (ZCTA5) — North Carolina
- Housing Owner-Occupied % of Units, by Zip Code (ZCTA5) — North Carolina
- Housing % of Units Built Since 2010, by Zip Code (ZCTA5) — North Carolina
- Household Average Size by Zip Code (ZCTA5) — North Carolina
- Housing Vacancy Rate by Zip Code (ZCTA5) — North Carolina
- Household Median Income by Zip Code (ZCTA5) — Michigan
- Population Non-Hispanic White % by Zip Code (ZCTA5) — Ohio
- Population Non-Hispanic White % by Zip Code (ZCTA5) — Utah
- Population Non-Hispanic White % by Zip Code (ZCTA5) — Iowa
- Population Non-Hispanic White % by Zip Code (ZCTA5) — Maine
- Population Non-Hispanic White % by Zip Code (ZCTA5) — Idaho
- Population Non-Hispanic White % by Zip Code (ZCTA5) — Nevada
- Population Non-Hispanic White % by Zip Code (ZCTA5) — Oregon
- Population Non-Hispanic White % by Zip Code (ZCTA5) — Texas
- Population Non-Hispanic White % by Zip Code (ZCTA5) — Hawaii
- Population Non-Hispanic White % by Zip Code (ZCTA5) — Colorado