NOTE: Gray indicates insufficient data or a suppressed estimate.
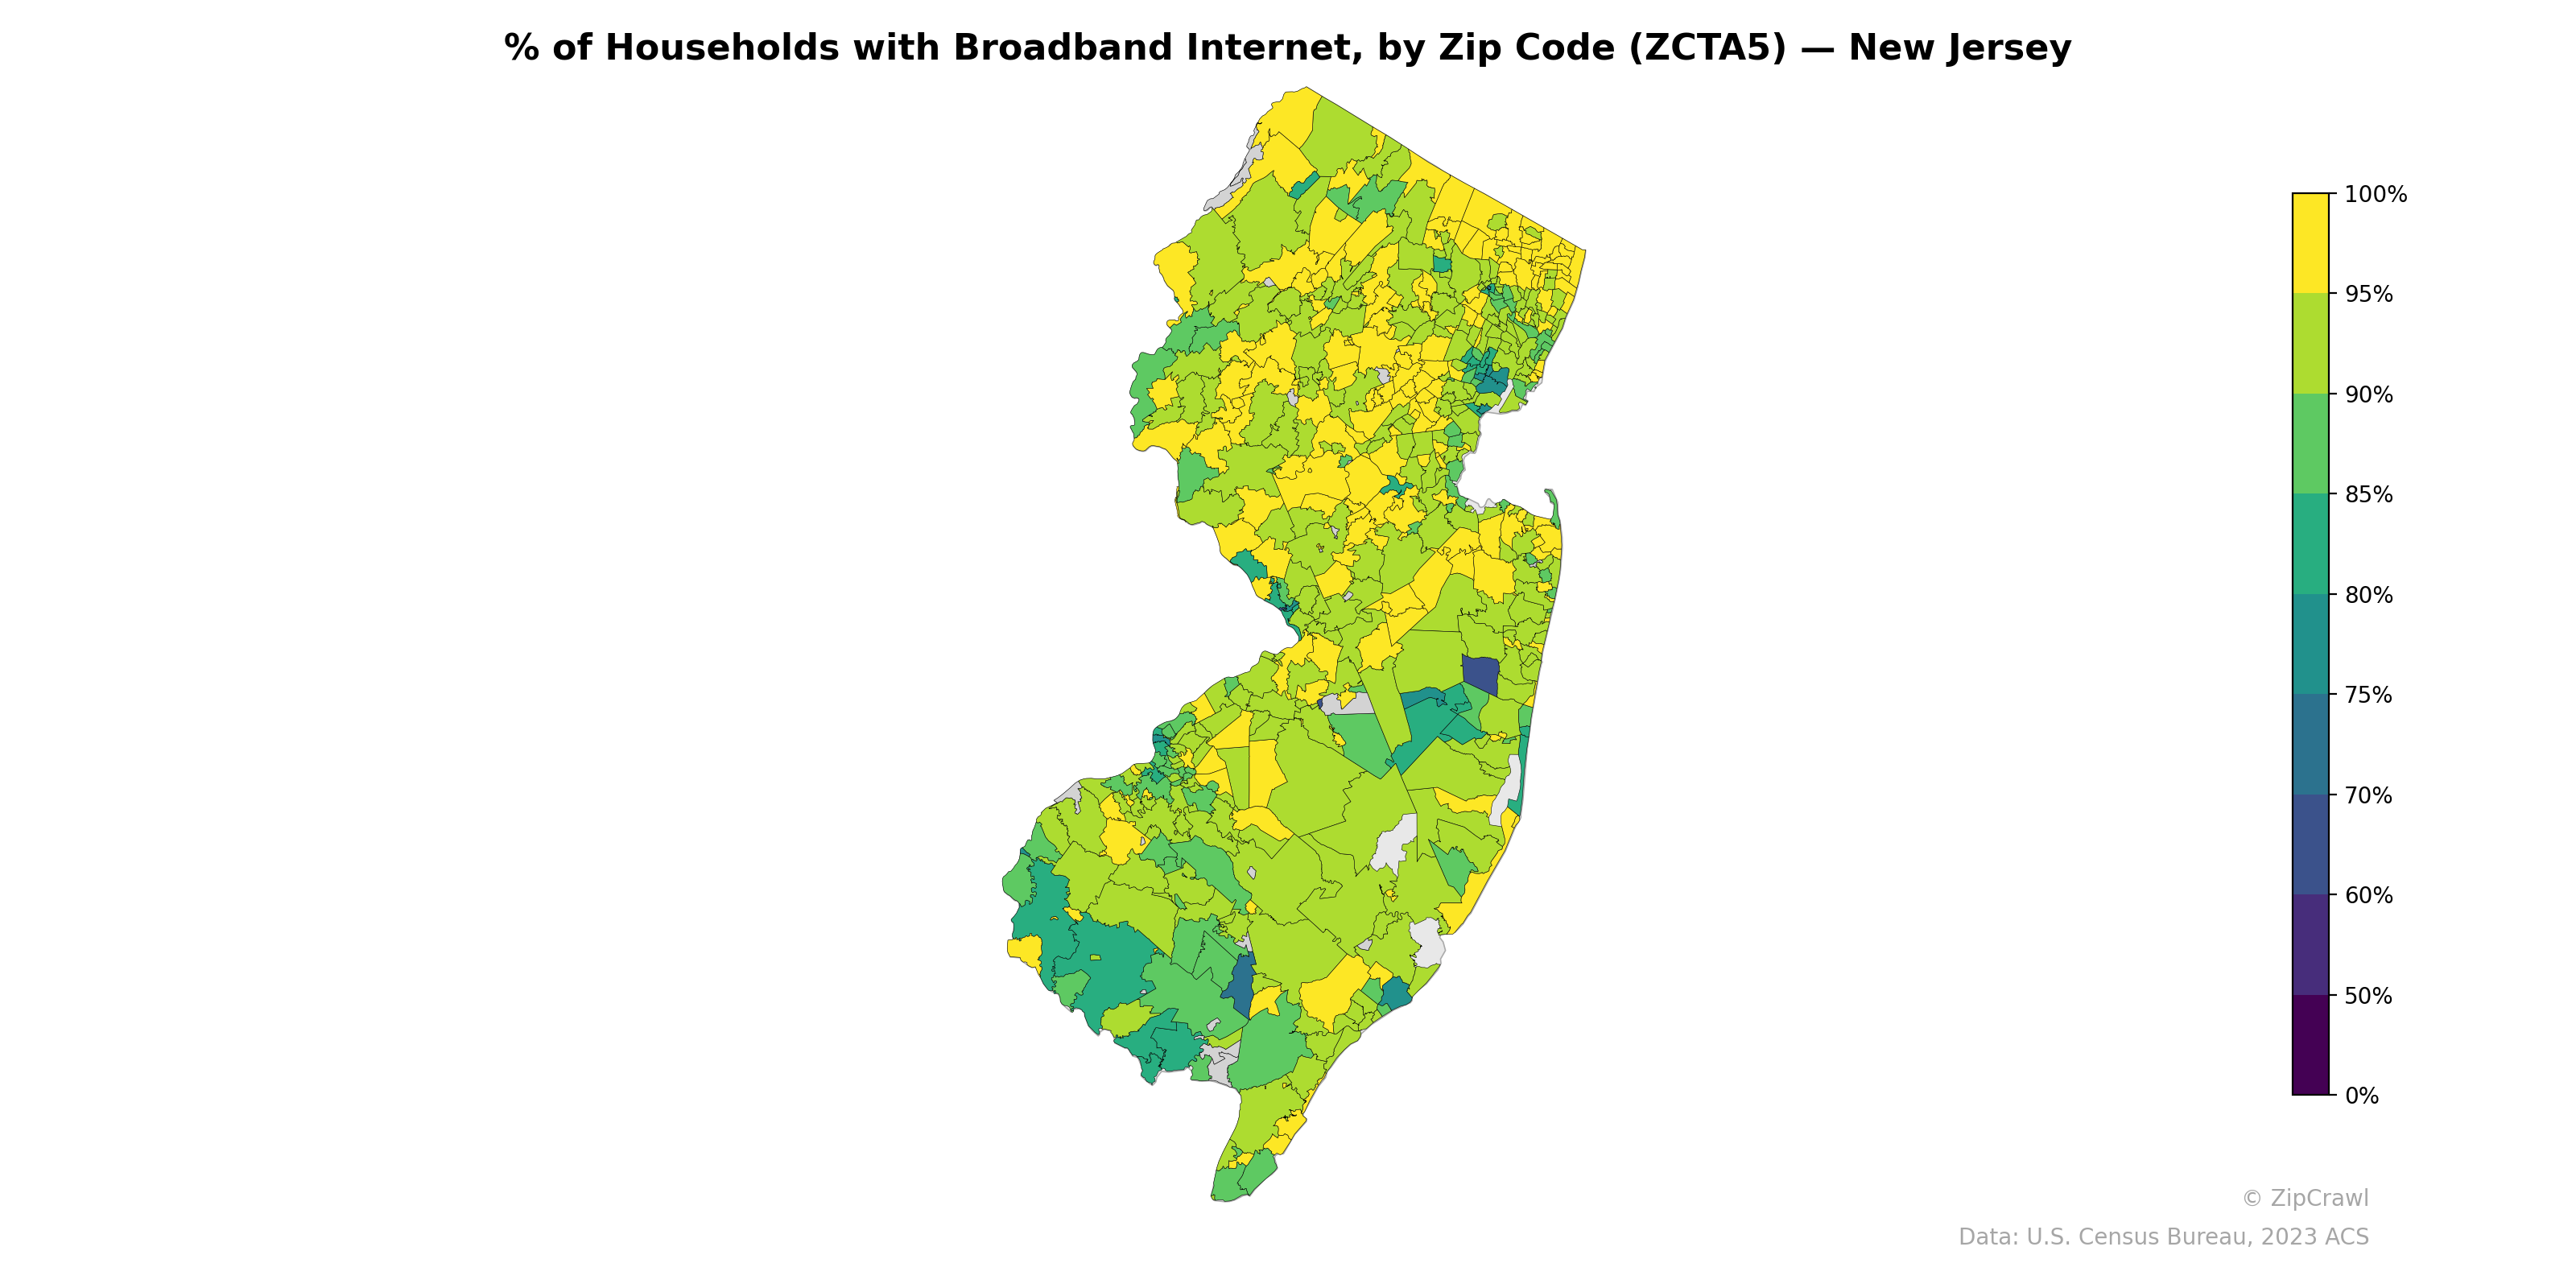
Northern New Jersey zip codes, particularly in Bergen, Morris, and Somerset counties, consistently display broadband adoption rates above 90%, reflecting the affluent suburban corridor with strong infrastructure investment. The southern portion of the state, especially parts of Cumberland and Cape May counties, exhibits noticeably lower broadband penetration, with several zip codes falling below 70% and a few dipping near 50% or lower. Urban cores such as Newark, Trenton, and Camden also stand out as pockets of lower connectivity compared to their surrounding suburbs, highlighting a persistent digital divide along both urban-rural and income lines.
Data: U.S. Census Bureau, 2023 ACS
Explore
- Housing % of Units Built Since 2010, by Zip Code (ZCTA5) — New York Metro
- Married Couple (% of all Households) by Zip Code (ZCTA5) — New Jersey
- % of Population without Health Insurance, by Zip Code (ZCTA5) — New Jersey
- Housing Owner-Occupied Median Value ($), by Zip Code (ZCTA5) — New Jersey
- Bachelor's Degree or Higher (% of Over 25) by Zip Code (ZCTA5) — New Jersey
- Housing Owner-Occupied % of Units, by Zip Code (ZCTA5) — New Jersey
- Household Average Size by Zip Code (ZCTA5) — New Jersey
- Housing Vacancy Rate by Zip Code (ZCTA5) — New Jersey
- Housing % of Units Built Since 2010, by Zip Code (ZCTA5) — New Jersey
- Housing Median Monthly Rent ($), by Zip Code (ZCTA5) — New Jersey
- Housing Vacancy Rate by Zip Code (ZCTA5) — New Mexico
- Population Non-Hispanic White % by County
- % of Population without Health Insurance, by Zip Code (ZCTA5) — New York Metro
- Married Couple (% of all Households) by Zip Code (ZCTA5) — New York Metro
- Housing Owner-Occupied Median Value ($), by Zip Code (ZCTA5) — New York Metro
- Housing Vacancy Rate by Zip Code (ZCTA5) — New York Metro
- Housing Median Monthly Rent ($), by Zip Code (ZCTA5) — New York Metro
- Household Average Size by Zip Code (ZCTA5) — New York Metro
- Population Non-Hispanic Asian % by Zip Code (ZCTA5) — New York Metro
- Population Non-Hispanic Asian % by Zip Code (ZCTA5) — North Carolina
- Married Couple (% of all Households) by Zip Code (ZCTA5) — North Carolina
- % of Population on Food Stamps or SNAP (Last 12 Months), by Zip Code (ZCTA5) — North Carolina
- % of Population without Health Insurance, by Zip Code (ZCTA5) — North Carolina
- Housing Owner-Occupied Median Value ($), by Zip Code (ZCTA5) — North Carolina
- High School Graduate (% of Over 25) by Zip Code (ZCTA5) — North Carolina
- Housing Owner-Occupied % of Units, by Zip Code (ZCTA5) — North Carolina
- Housing % of Units Built Since 2010, by Zip Code (ZCTA5) — North Carolina
- Household Average Size by Zip Code (ZCTA5) — North Carolina
- Housing Vacancy Rate by Zip Code (ZCTA5) — North Carolina
- Bachelor's Degree or Higher (% of Over 25) by Zip Code (ZCTA5) — North Carolina
- % of Households with Broadband Internet, by Zip Code (ZCTA5) — New York
- % of Households with Broadband Internet, by Zip Code (ZCTA5) — New Mexico
- % of Households with Broadband Internet, by Zip Code (ZCTA5) — Nevada
- % of Households with Broadband Internet, by Zip Code (ZCTA5) — New Hampshire
- % of Households with Broadband Internet, by Zip Code (ZCTA5) — Ohio
- % of Households with Broadband Internet, by Zip Code (ZCTA5) — Iowa
- % of Households with Broadband Internet, by Zip Code (ZCTA5) — Nebraska
- % of Households with Broadband Internet, by Zip Code (ZCTA5) — Utah
- % of Households with Broadband Internet, by Zip Code (ZCTA5) — Idaho
- % of Households with Broadband Internet, by Zip Code (ZCTA5) — New York Metro