NOTE: Gray indicates insufficient data or a suppressed estimate.
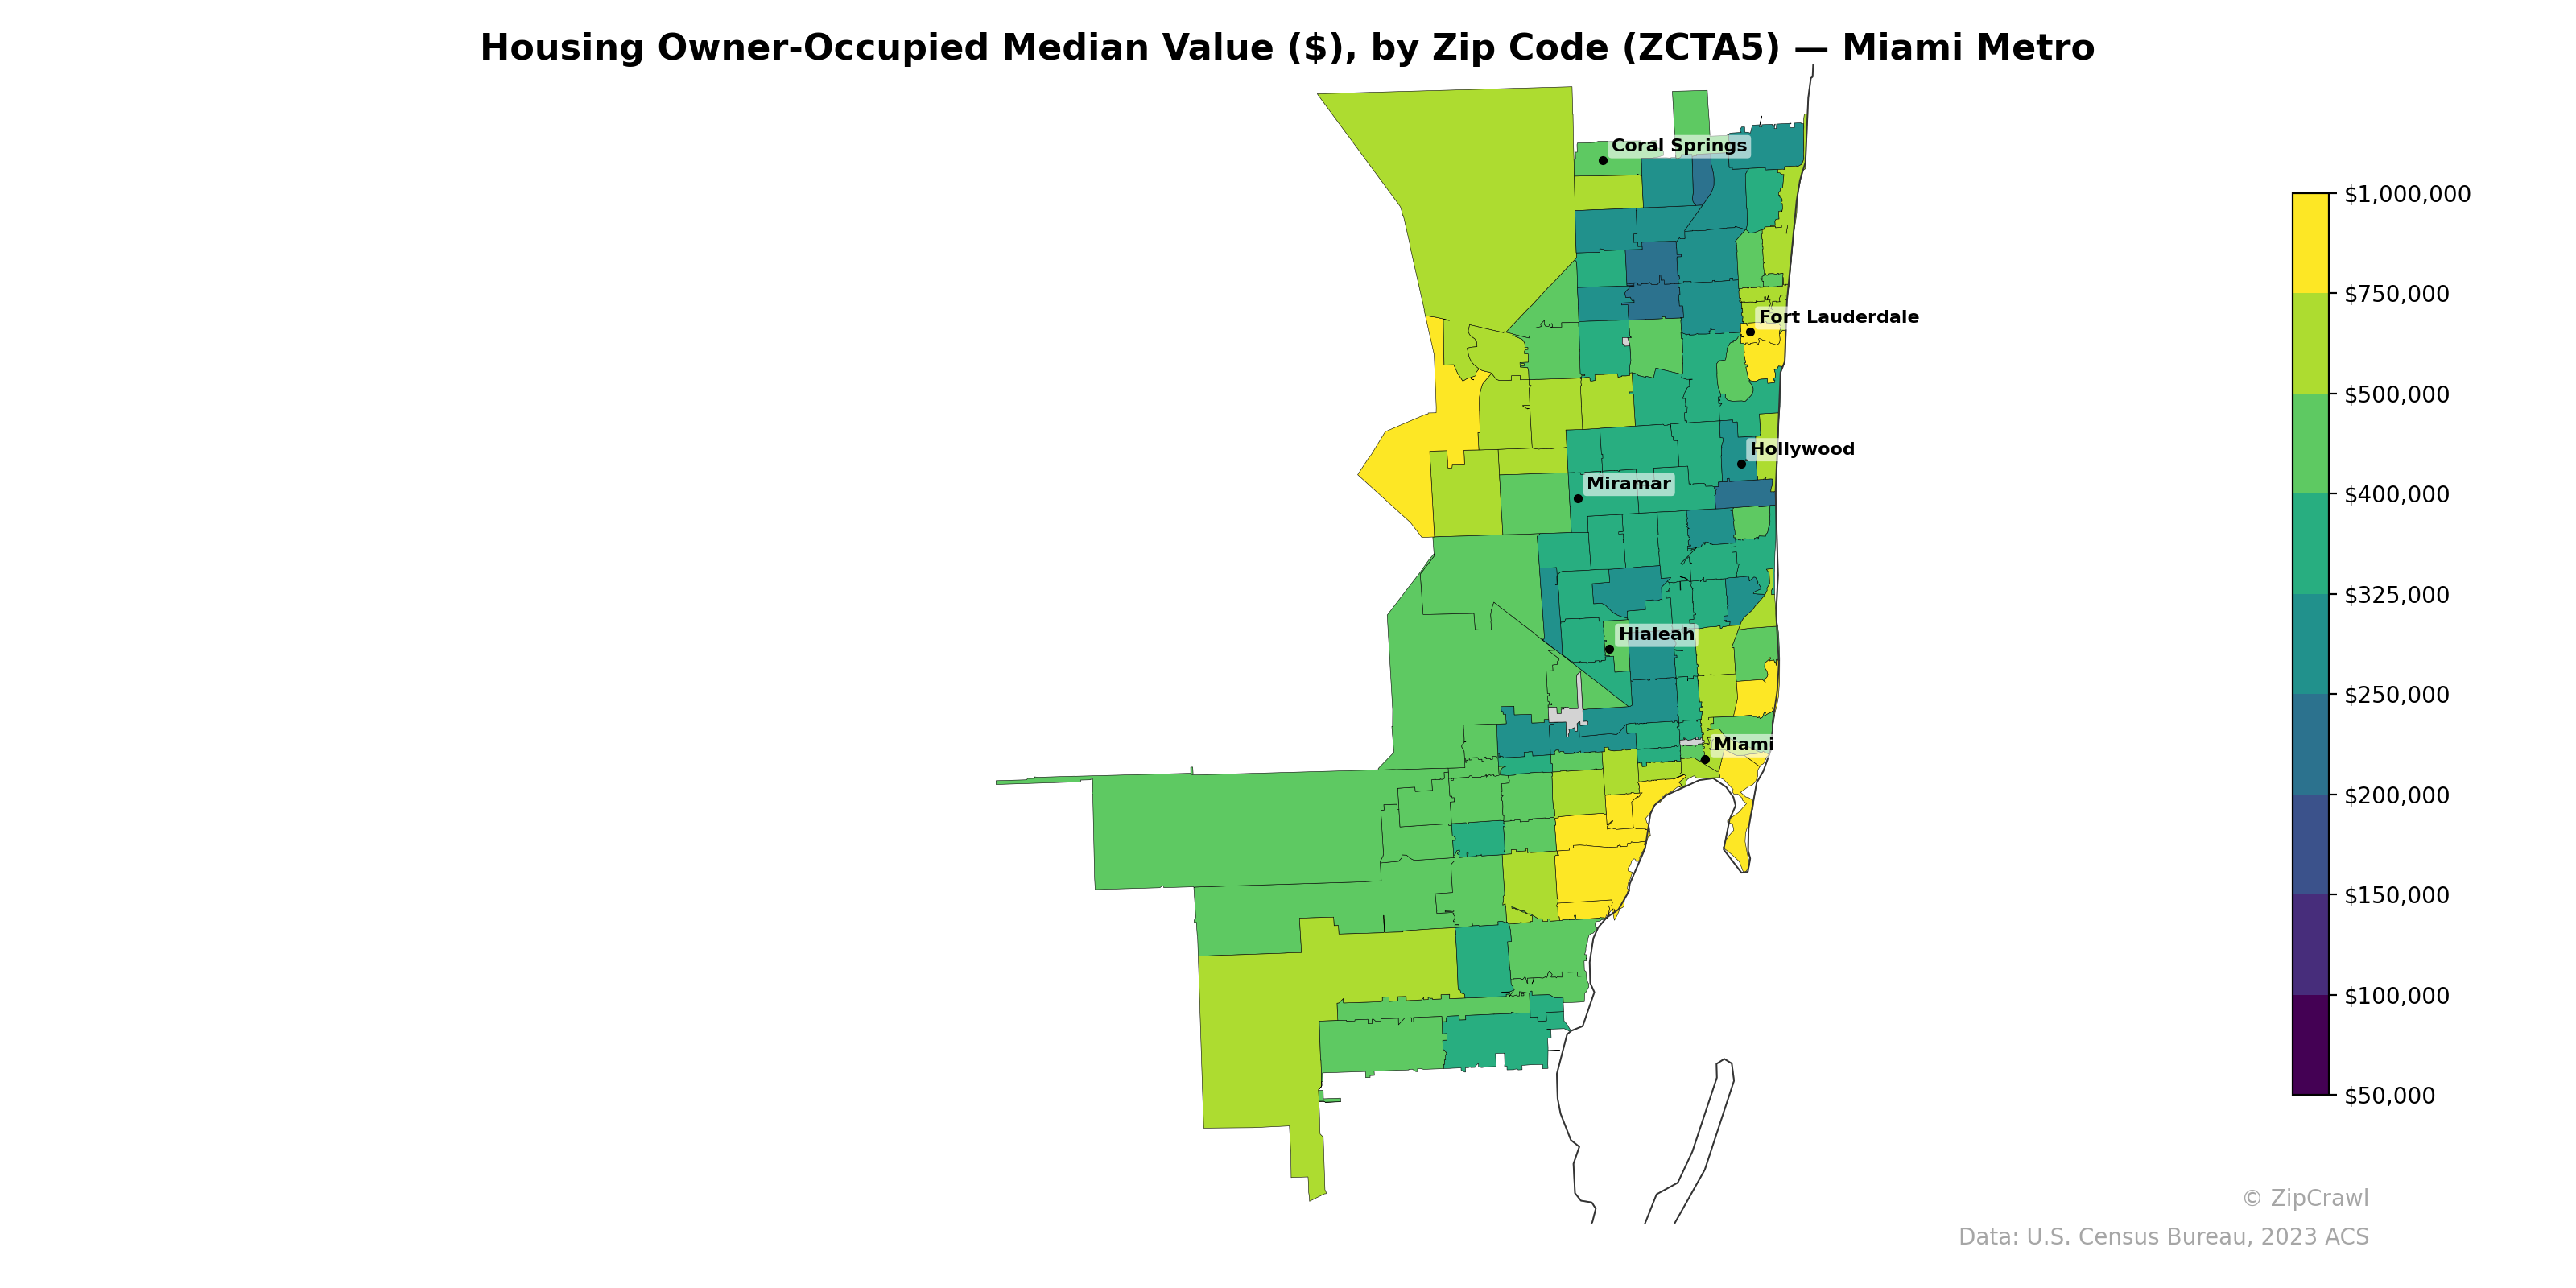
Coastal zip codes along the Atlantic from Fort Lauderdale south through Miami Beach consistently display the highest median owner-occupied housing values, frequently exceeding $500,000 and approaching $1,000,000, while inland areas west of I-95—particularly around Hialeah and western Miramar—cluster in the $250,000–$350,000 range. A notable pocket of lower values (below $200,000) appears in zip codes immediately northwest of downtown Miami, contrasting sharply with adjacent high-value coastal zones just miles to the east. The far western suburban fringe, including areas west of Coral Springs and into the Everglades buffer, shows moderate values in the $350,000–$500,000 range, suggesting newer suburban development commanding premiums over older inland urban cores.
Data: U.S. Census Bureau, 2023 ACS
Explore
- Bachelor's Degree or Higher (% of Over 25) by Zip Code (ZCTA5) — New York Metro
- Housing Vacancy Rate by Zip Code (ZCTA5) — Miami Metro
- Bachelor's Degree or Higher (% of Over 25) by Zip Code (ZCTA5) — Miami Metro
- Housing Owner-Occupied % of Units, by Zip Code (ZCTA5) — Miami Metro
- Married Couple (% of all Households) by Zip Code (ZCTA5) — Miami Metro
- Household Average Size by Zip Code (ZCTA5) — Miami Metro
- Housing Median Monthly Rent ($), by Zip Code (ZCTA5) — Miami Metro
- % of Households with Broadband Internet, by Zip Code (ZCTA5) — Miami Metro
- Housing % of Units Built Since 2010, by Zip Code (ZCTA5) — Miami Metro
- % of Population without Health Insurance, by Zip Code (ZCTA5) — Miami Metro
- U.S. Citizens (% of Population Over 18) by Zip Code (ZCTA5) — Mississippi
- Median Age by County
- U.S. Citizens (% of Population Over 18) by Zip Code (ZCTA5) — New York Metro
- Population Hispanic % by Zip Code (ZCTA5) — New York Metro
- Population Non-Hispanic White % by Zip Code (ZCTA5) — New York Metro
- High School Graduate (% of Over 25) by Zip Code (ZCTA5) — New York Metro
- % of Population on Food Stamps or SNAP (Last 12 Months), by County
- Median Age by Zip Code (ZCTA5) — New York Metro
- Population Non-Hispanic Black % by Zip Code (ZCTA5) — New York Metro
- Household Median Income by Zip Code (ZCTA5) — New York Metro
- Population Non-Hispanic American Indian % by Zip Code (ZCTA5) — New York Metro
- % of Population without Health Insurance, by Zip Code (ZCTA5) — Ohio
- Bachelor's Degree or Higher (% of Over 25) by Zip Code (ZCTA5) — Ohio
- Housing Owner-Occupied % of Units, by Zip Code (ZCTA5) — Ohio
- Population Non-Hispanic White % by Zip Code (ZCTA5) — Ohio
- Median Age by Zip Code (ZCTA5) — Ohio
- Population Non-Hispanic American Indian % by Zip Code (ZCTA5) — Ohio
- High School Graduate (% of Over 25) by Zip Code (ZCTA5) — Ohio
- % of Households with Broadband Internet, by Zip Code (ZCTA5) — Ohio
- Population Hispanic % by Zip Code (ZCTA5) — Ohio
- Housing Owner-Occupied Median Value ($), by Zip Code (ZCTA5) — Houston Metro
- Housing Owner-Occupied Median Value ($), by Zip Code (ZCTA5) — Denver Metro
- Housing Owner-Occupied Median Value ($), by Zip Code (ZCTA5) — Tampa Metro
- Housing Owner-Occupied Median Value ($), by Zip Code (ZCTA5) — Detroit Metro
- Housing Owner-Occupied Median Value ($), by Zip Code (ZCTA5) — Boston Metro
- Housing Owner-Occupied Median Value ($), by Zip Code (ZCTA5) — Chicago Metro
- Housing Owner-Occupied Median Value ($), by Zip Code (ZCTA5) — Austin Metro
- Housing Owner-Occupied Median Value ($), by Zip Code (ZCTA5) — Dallas Metro
- Housing Owner-Occupied Median Value ($), by Zip Code (ZCTA5) — Orlando Metro
- Housing Owner-Occupied Median Value ($), by Zip Code (ZCTA5) — Atlanta Metro