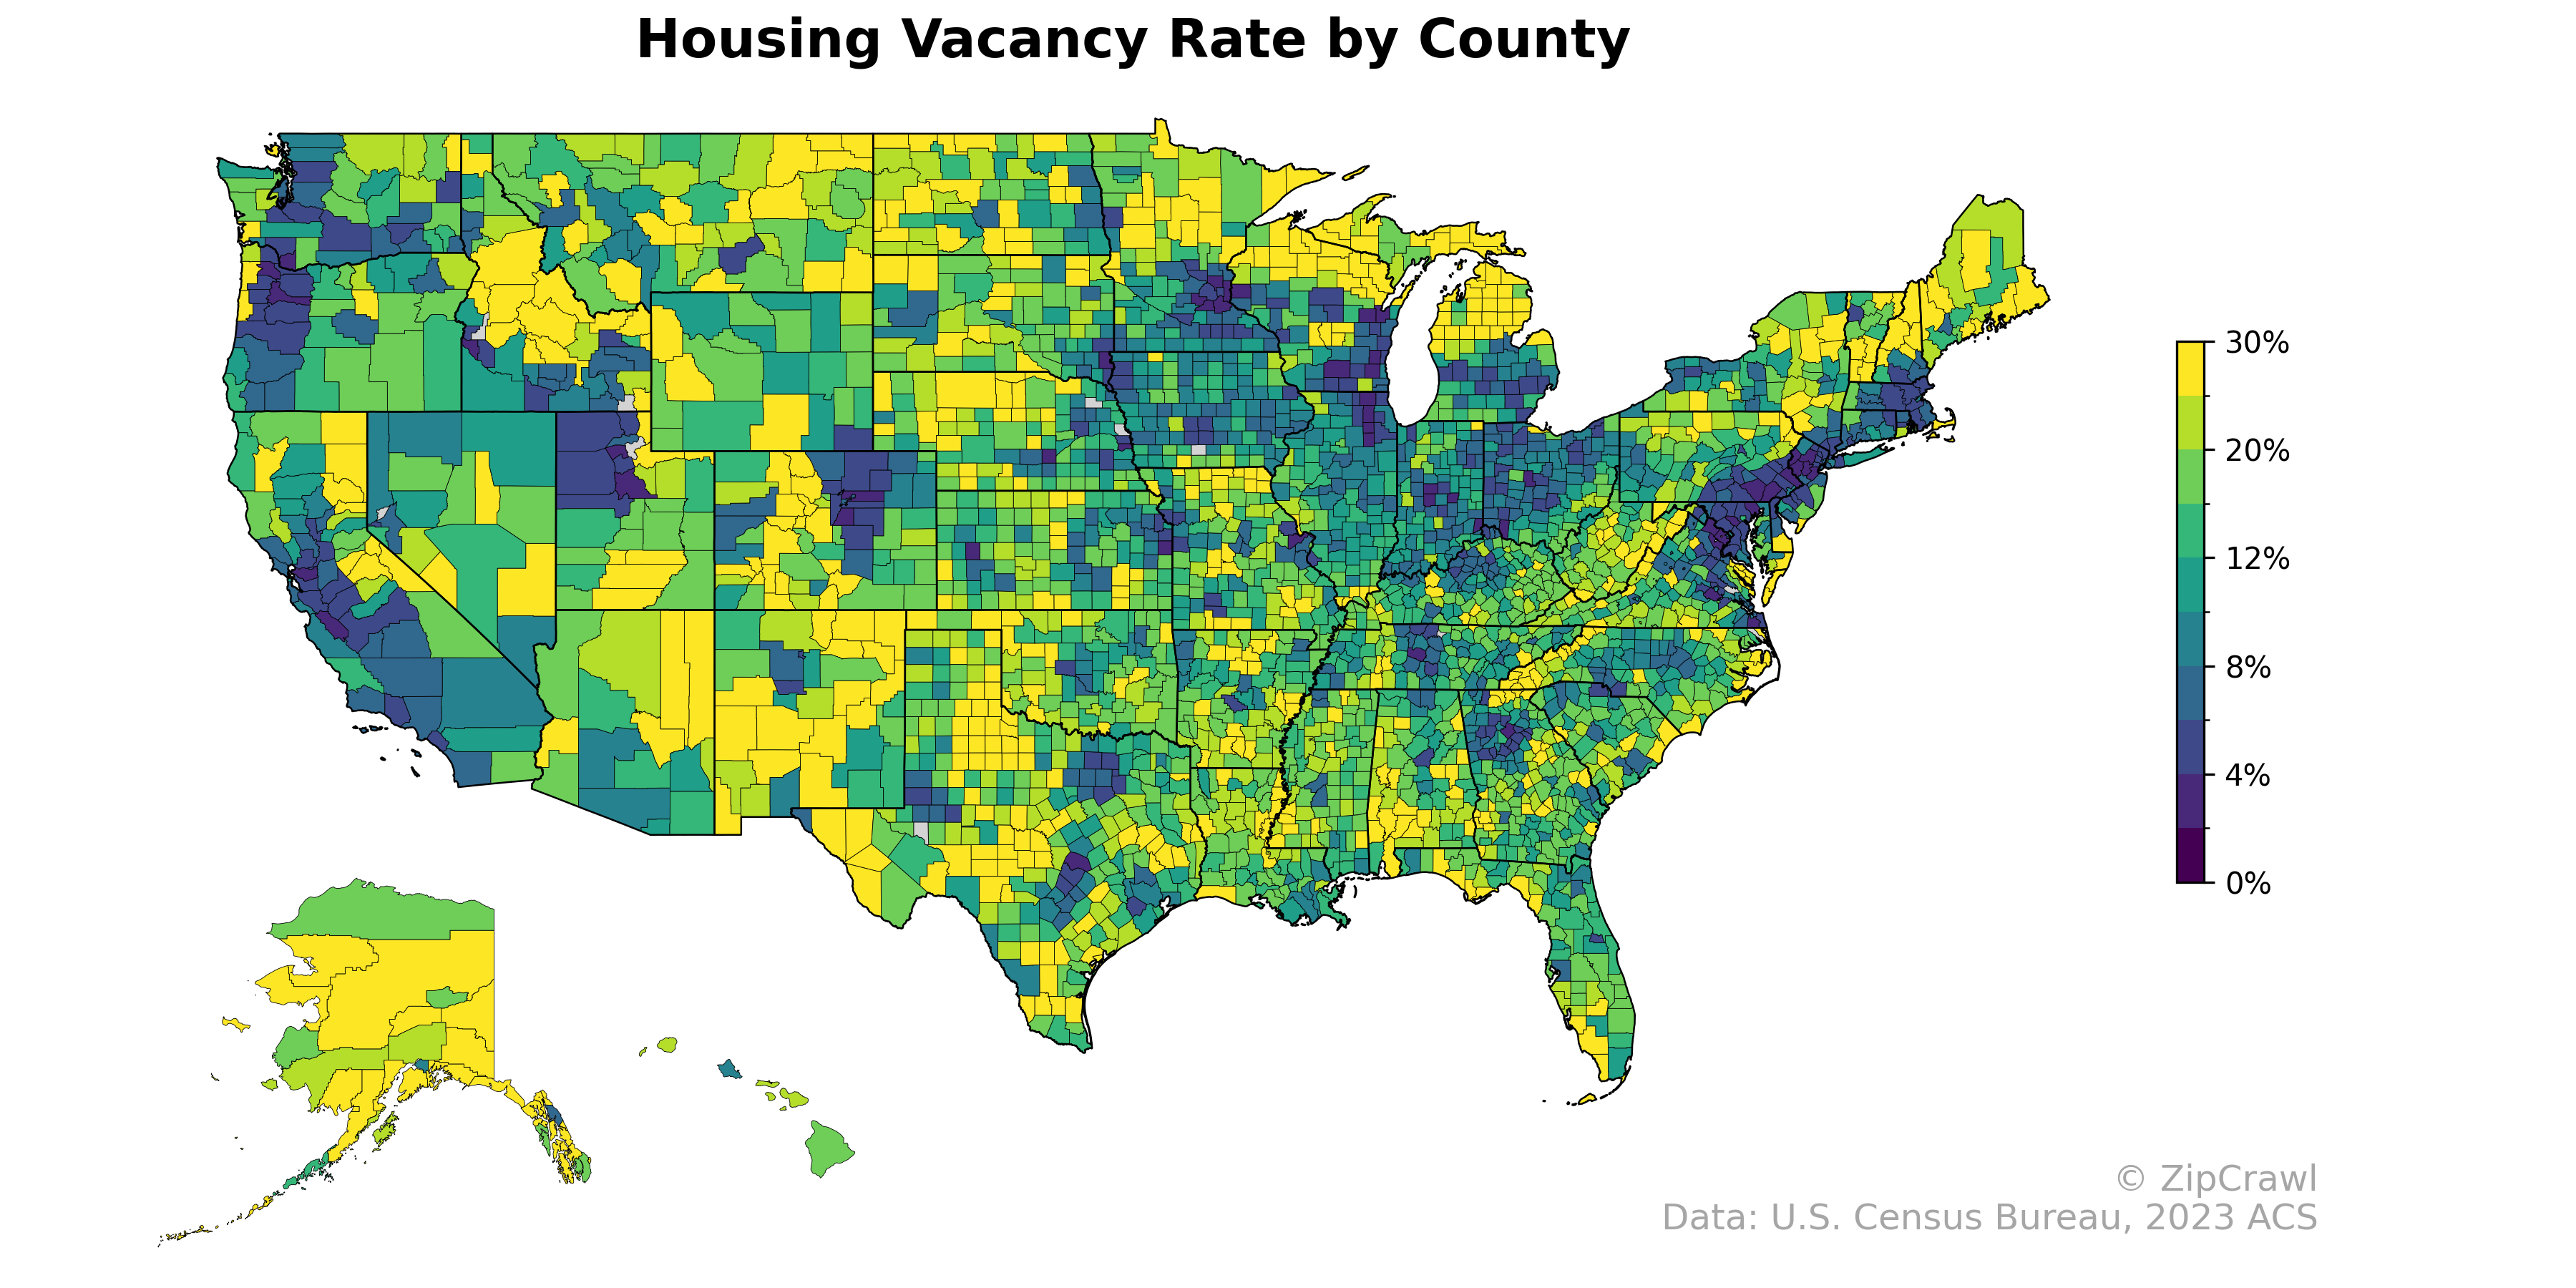
NOTE: Gray indicates insufficient data or a suppressed estimate.
Explore housing vacancy rates across American counties - but read carefully, as this metric captures far more than abandoned homes. The Census vacancy rate includes seasonal homes, vacation properties, and second residences, making the bright yellow concentrations in lake country, ski resorts, and coastal areas indicators of recreational wealth rather than economic distress. The deepest purple metros show tight markets where nearly every unit serves as someone's primary year-round residence.
Data: U.S. Census Bureau, 2023 ACS
Explore
- Housing Owner-Occupied % of Units, by Zip Code (ZCTA5) — Pennsylvania
- Housing Owner-Occupied Median Value ($), by Zip Code (ZCTA5) — Pennsylvania
- Household Average Size by Zip Code (ZCTA5) — Pennsylvania
- Housing Median Monthly Rent ($), by Zip Code (ZCTA5) — Pennsylvania
- Bachelor's Degree or Higher (% of Over 25) by Zip Code (ZCTA5) — Pennsylvania
- % of Population without Health Insurance, by Zip Code (ZCTA5) — Pennsylvania
- Married Couple (% of all Households) by Zip Code (ZCTA5) — Pennsylvania
- % of Households with Broadband Internet, by Zip Code (ZCTA5) — Pennsylvania
- Housing % of Units Built Since 2010, by Zip Code (ZCTA5) — Pennsylvania
- Population Non-Hispanic Black % by Zip Code (ZCTA5) — Wyoming
- Population Non-Hispanic Black % by Zip Code (ZCTA5) — Kansas
- Population Non-Hispanic Black % by Zip Code (ZCTA5) — Delaware
- Population Non-Hispanic Black % by Zip Code (ZCTA5) — Utah
- Population Non-Hispanic Black % by Zip Code (ZCTA5) — Louisiana
- Population Non-Hispanic Black % by Zip Code (ZCTA5) — Hawaii
- Household Median Income by County
- Household Average Size by County
- U.S. Citizens by County (% of Population Over 18)
- Housing Median Monthly Rent ($), by County
- Housing Owner-Occupied Median Value ($), by County
- Housing Owner-Occupied % of Units, by County
- % of Households with Broadband Internet, by County
- Housing % of Units Built Since 2010, by County
- Population Non-Hispanic Asian % by County
- Married Couple (% of all Households) by County
- Housing Owner-Occupied Median Value ($), by Zip Code (ZCTA5) — California
- % of Population without Health Insurance, by Zip Code (ZCTA5) — California
- Housing Owner-Occupied % of Units, by Zip Code (ZCTA5) — California
- Housing % of Units Built Since 2010, by Zip Code (ZCTA5) — California
- High School Graduate (% of Over 25) by Zip Code (ZCTA5) — California
- Housing Vacancy Rate by Zip Code (ZCTA5) — Iowa
- Housing Vacancy Rate by Zip Code (ZCTA5) — Utah
- Housing Vacancy Rate by Zip Code (ZCTA5) — Ohio
- Housing Vacancy Rate by Zip Code (ZCTA5) — Texas
- Housing Vacancy Rate by Zip Code (ZCTA5) — Hawaii
- Housing Vacancy Rate by Zip Code (ZCTA5) — Wyoming
- Housing Vacancy Rate by Zip Code (ZCTA5) — Idaho
- Housing Vacancy Rate by Zip Code (ZCTA5) — Maine
- Housing Vacancy Rate by Zip Code (ZCTA5) — Colorado
- Housing Vacancy Rate by Zip Code (ZCTA5) — Kansas