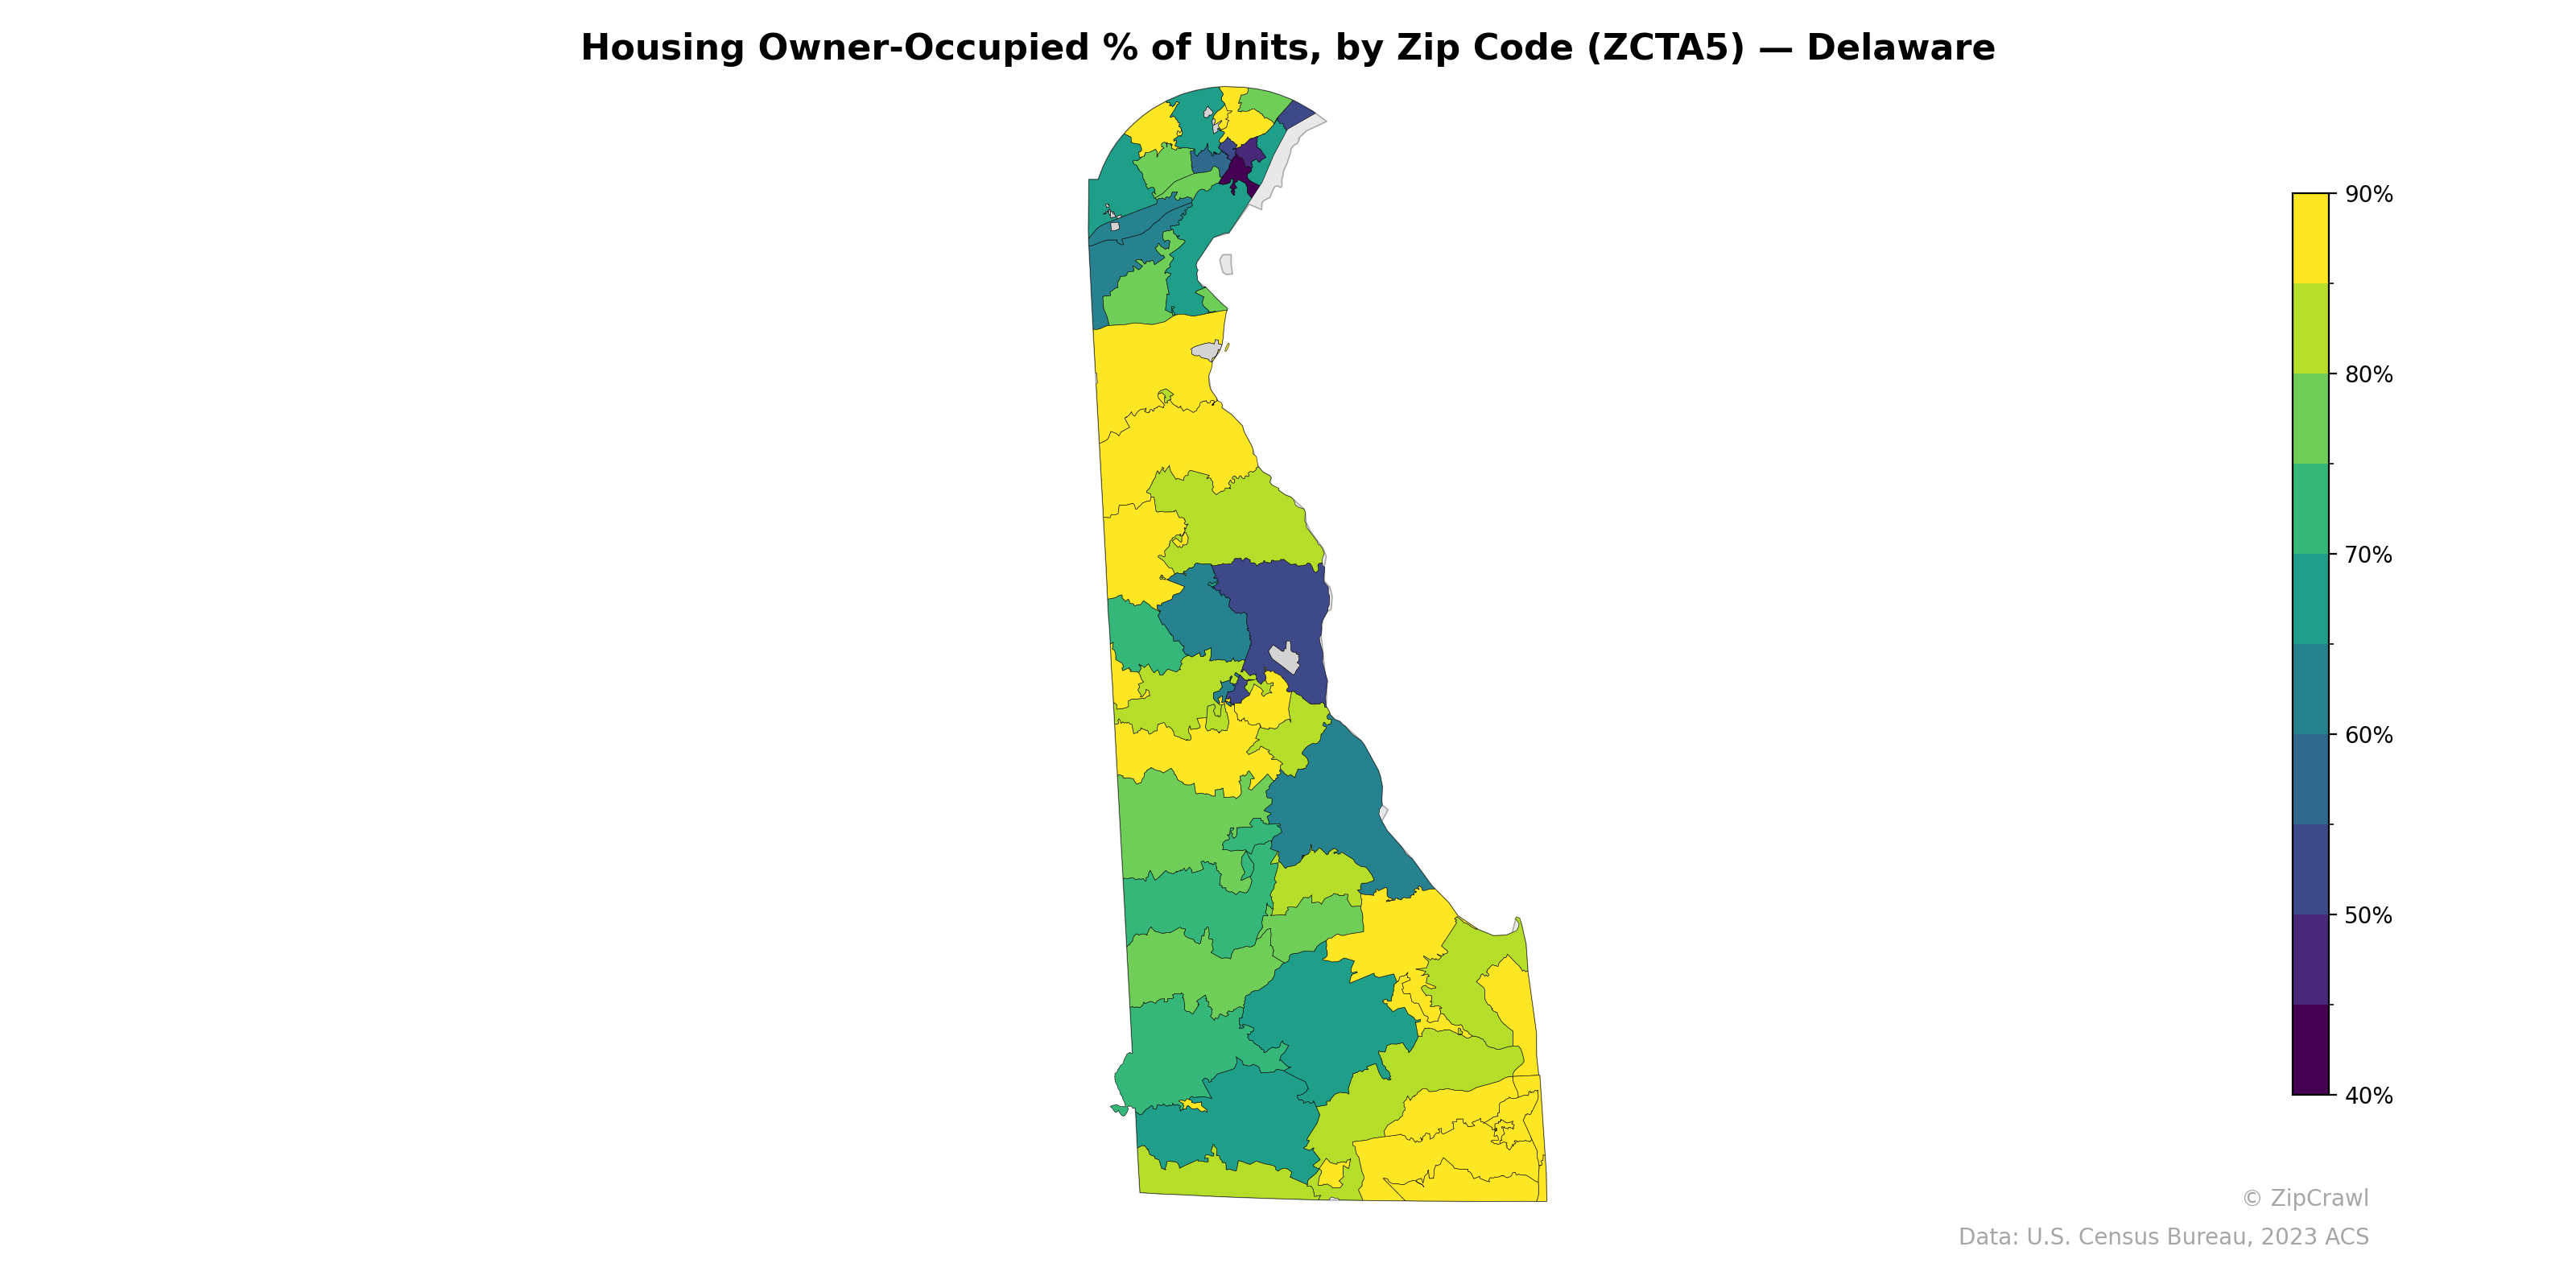
NOTE: Gray indicates insufficient data or a suppressed estimate.
Owner-occupancy rates in Delaware exhibit a clear north-south gradient, with the highest concentrations (85–90%+) clustered in the rural and suburban zip codes of central Kent County and western Sussex County, appearing in bright yellow. The Wilmington metro area in New Castle County displays significant internal variation, with several urban zip codes near the city core dropping below 40–50%, contrasting sharply with surrounding suburban areas that reach 70–80%. Coastal Sussex County zip codes, particularly around Rehoboth Beach and the beach resort communities, show notably lower owner-occupancy rates in the 45–60% range, likely reflecting a high proportion of rental and seasonal housing stock.
Data: U.S. Census Bureau, 2023 ACS
Explore
- % of Population without Health Insurance, by Zip Code (ZCTA5) — New York
- Household Average Size by Zip Code (ZCTA5) — Delaware
- Population Non-Hispanic American Indian % by Zip Code (ZCTA5) — Delaware
- Bachelor's Degree or Higher (% of Over 25) by Zip Code (ZCTA5) — Delaware
- Housing Median Monthly Rent ($), by Zip Code (ZCTA5) — Delaware
- Housing % of Units Built Since 2010, by Zip Code (ZCTA5) — Delaware
- Housing Owner-Occupied Median Value ($), by Zip Code (ZCTA5) — Delaware
- % of Population without Health Insurance, by Zip Code (ZCTA5) — Delaware
- % of Households with Broadband Internet, by Zip Code (ZCTA5) — Delaware
- High School Graduate (% of Over 25) by Zip Code (ZCTA5) — Delaware
- Household Average Size by County
- Population Non-Hispanic White % by Zip Code (ZCTA5) — Massachusetts
- Married Couple (% of all Households) by Zip Code (ZCTA5) — New York
- Housing Owner-Occupied Median Value ($), by Zip Code (ZCTA5) — New York
- Housing Median Monthly Rent ($), by Zip Code (ZCTA5) — New York
- % of Households with Broadband Internet, by Zip Code (ZCTA5) — New York
- Housing % of Units Built Since 2010, by Zip Code (ZCTA5) — New York
- Population Non-Hispanic White % by Zip Code (ZCTA5) — Florida
- Housing Vacancy Rate by Zip Code (ZCTA5) — New York
- Bachelor's Degree or Higher (% of Over 25) by Zip Code (ZCTA5) — New York
- Household Average Size by Zip Code (ZCTA5) — New York
- Bachelor's Degree or Higher (% of Over 25) by Zip Code (ZCTA5) — Rhode Island
- Population Non-Hispanic American Indian % by Zip Code (ZCTA5) — Rhode Island
- Population Non-Hispanic Asian % by Zip Code (ZCTA5) — Rhode Island
- Population Non-Hispanic Black % by Zip Code (ZCTA5) — North Dakota
- Married Couple (% of all Households) by Zip Code (ZCTA5) — Rhode Island
- Housing Vacancy Rate by Zip Code (ZCTA5) — Alaska
- Population Non-Hispanic American Indian % by Zip Code (ZCTA5) — North Dakota
- High School Graduate (% of Over 25) by Zip Code (ZCTA5) — Rhode Island
- % of Households with Broadband Internet, by Zip Code (ZCTA5) — Rhode Island
- Housing Owner-Occupied % of Units, by Zip Code (ZCTA5) — Hawaii
- Housing Owner-Occupied % of Units, by Zip Code (ZCTA5) — Ohio
- Housing Owner-Occupied % of Units, by Zip Code (ZCTA5) — Utah
- Housing Owner-Occupied % of Units, by Zip Code (ZCTA5) — Iowa
- Housing Owner-Occupied % of Units, by Zip Code (ZCTA5) — Texas
- Housing Owner-Occupied % of Units, by Zip Code (ZCTA5) — Idaho
- Housing Owner-Occupied % of Units, by Zip Code (ZCTA5) — Wyoming
- Housing Owner-Occupied % of Units, by Zip Code (ZCTA5) — Oregon
- Housing Owner-Occupied % of Units, by Zip Code (ZCTA5) — Maine
- Housing Owner-Occupied % of Units, by Zip Code (ZCTA5) — Nevada