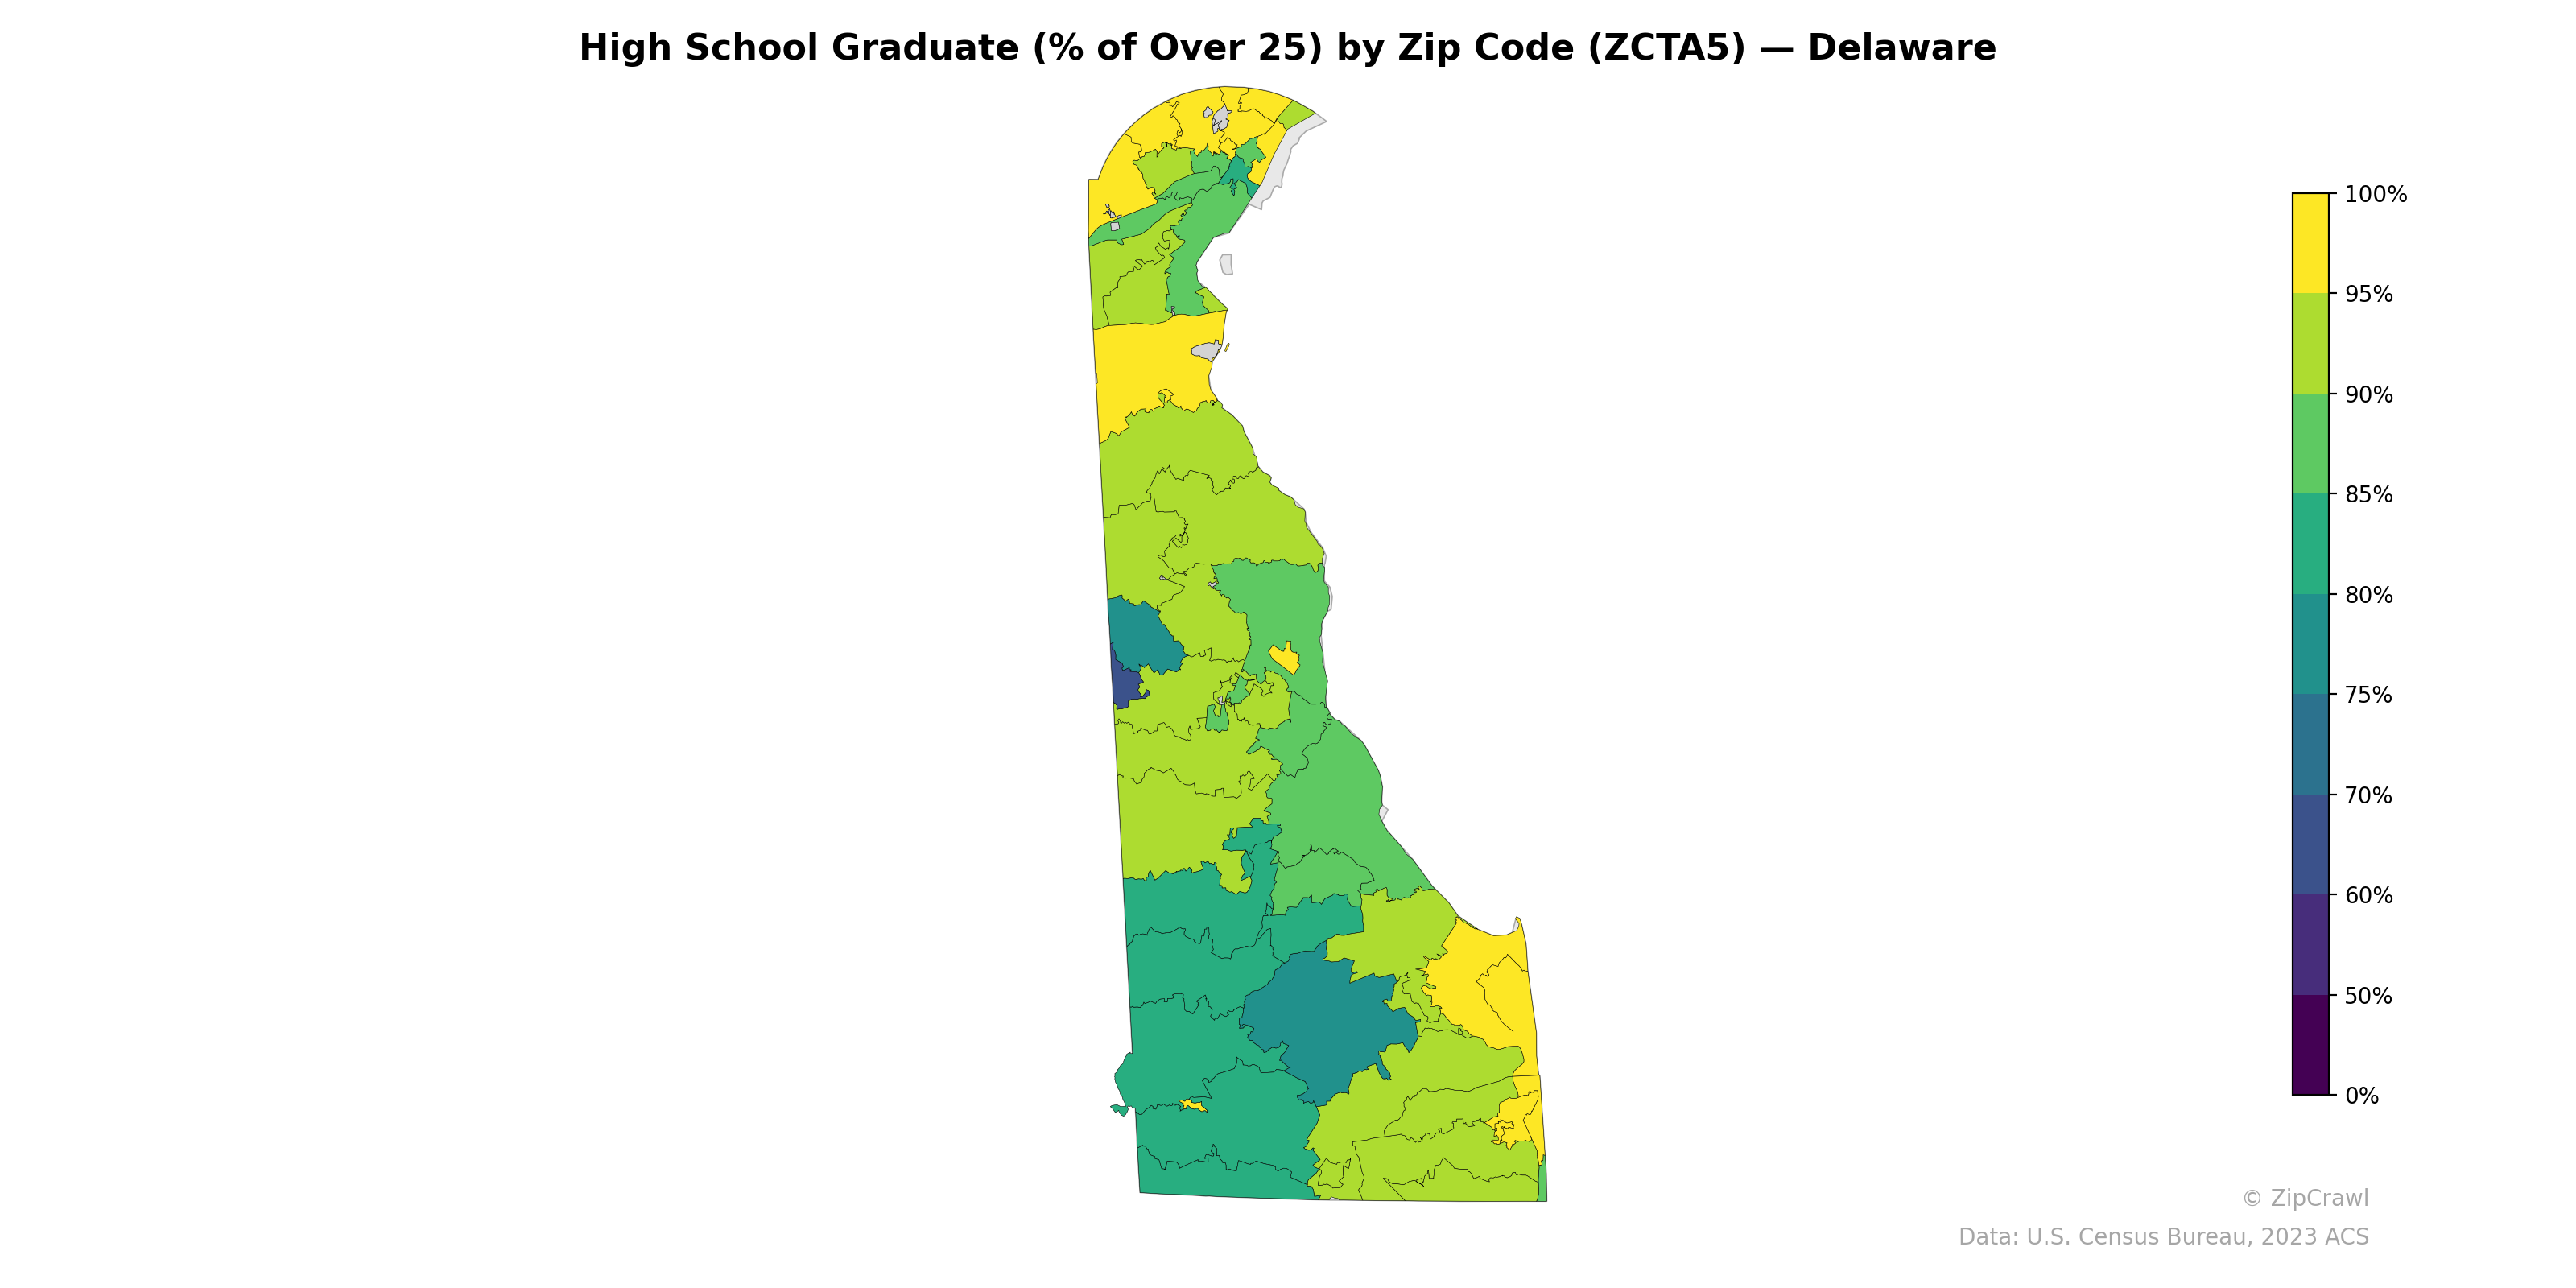
NOTE: Gray indicates insufficient data or a suppressed estimate.
Northern Delaware's zip codes near Wilmington display significant variation, with affluent suburban areas reaching above 95% high school graduation rates while a cluster of zip codes in the city core drops below 75%, representing the starkest intra-regional contrast in the state. Central and southern Delaware generally maintain graduation rates in the 80–90% range, though a notable pocket of lower attainment (around 60–70%) appears in the southeastern coastal area near the lower Sussex County region. The highest-performing zip codes concentrate along the northern suburban corridor and select beach communities, while the lowest rates align with areas of higher poverty and immigrant populations in Wilmington and parts of southern Delaware's agricultural zones.
Data: U.S. Census Bureau, 2023 ACS
Explore
- % of Population without Health Insurance, by Zip Code (ZCTA5) — New York
- Housing % of Units Built Since 2010, by Zip Code (ZCTA5) — Delaware
- Housing Median Monthly Rent ($), by Zip Code (ZCTA5) — Delaware
- Housing Owner-Occupied Median Value ($), by Zip Code (ZCTA5) — Delaware
- Household Average Size by Zip Code (ZCTA5) — Delaware
- Population Non-Hispanic American Indian % by Zip Code (ZCTA5) — Delaware
- Housing Owner-Occupied % of Units, by Zip Code (ZCTA5) — Delaware
- % of Households with Broadband Internet, by Zip Code (ZCTA5) — Delaware
- % of Population without Health Insurance, by Zip Code (ZCTA5) — Delaware
- Bachelor's Degree or Higher (% of Over 25) by Zip Code (ZCTA5) — Delaware
- Household Average Size by County
- Household Average Size by Zip Code (ZCTA5) — New York
- Married Couple (% of all Households) by Zip Code (ZCTA5) — New York
- % of Population on Food Stamps or SNAP (Last 12 Months), by Zip Code (ZCTA5) — Tennessee
- Housing % of Units Built Since 2010, by Zip Code (ZCTA5) — New York
- Housing Owner-Occupied % of Units, by Zip Code (ZCTA5) — New York
- % of Households with Broadband Internet, by Zip Code (ZCTA5) — New York
- Housing Owner-Occupied Median Value ($), by Zip Code (ZCTA5) — New York
- % of Population on Food Stamps or SNAP (Last 12 Months), by Zip Code (ZCTA5) — California
- Bachelor's Degree or Higher (% of Over 25) by Zip Code (ZCTA5) — New York
- Housing Vacancy Rate by Zip Code (ZCTA5) — New York
- Housing Median Monthly Rent ($), by Zip Code (ZCTA5) — New York
- Population Non-Hispanic American Indian % by Zip Code (ZCTA5) — Rhode Island
- Housing Vacancy Rate by Zip Code (ZCTA5) — Alaska
- Housing Vacancy Rate by Zip Code (ZCTA5) — Rhode Island
- Household Average Size by Zip Code (ZCTA5) — Rhode Island
- Bachelor's Degree or Higher (% of Over 25) by Zip Code (ZCTA5) — Rhode Island
- Population Non-Hispanic Black % by Zip Code (ZCTA5) — North Dakota
- Population Non-Hispanic American Indian % by Zip Code (ZCTA5) — North Dakota
- Married Couple (% of all Households) by Zip Code (ZCTA5) — Rhode Island
- High School Graduate (% of Over 25) by Zip Code (ZCTA5) — Hawaii
- High School Graduate (% of Over 25) by Zip Code (ZCTA5) — Ohio
- High School Graduate (% of Over 25) by Zip Code (ZCTA5) — Iowa
- High School Graduate (% of Over 25) by Zip Code (ZCTA5) — Utah
- High School Graduate (% of Over 25) by Zip Code (ZCTA5) — Texas
- High School Graduate (% of Over 25) by Zip Code (ZCTA5) — Colorado
- High School Graduate (% of Over 25) by Zip Code (ZCTA5) — Idaho
- High School Graduate (% of Over 25) by Zip Code (ZCTA5) — Oregon
- High School Graduate (% of Over 25) by Zip Code (ZCTA5) — Maine
- High School Graduate (% of Over 25) by Zip Code (ZCTA5) — Denver Metro