NOTE: Gray indicates insufficient data or a suppressed estimate.
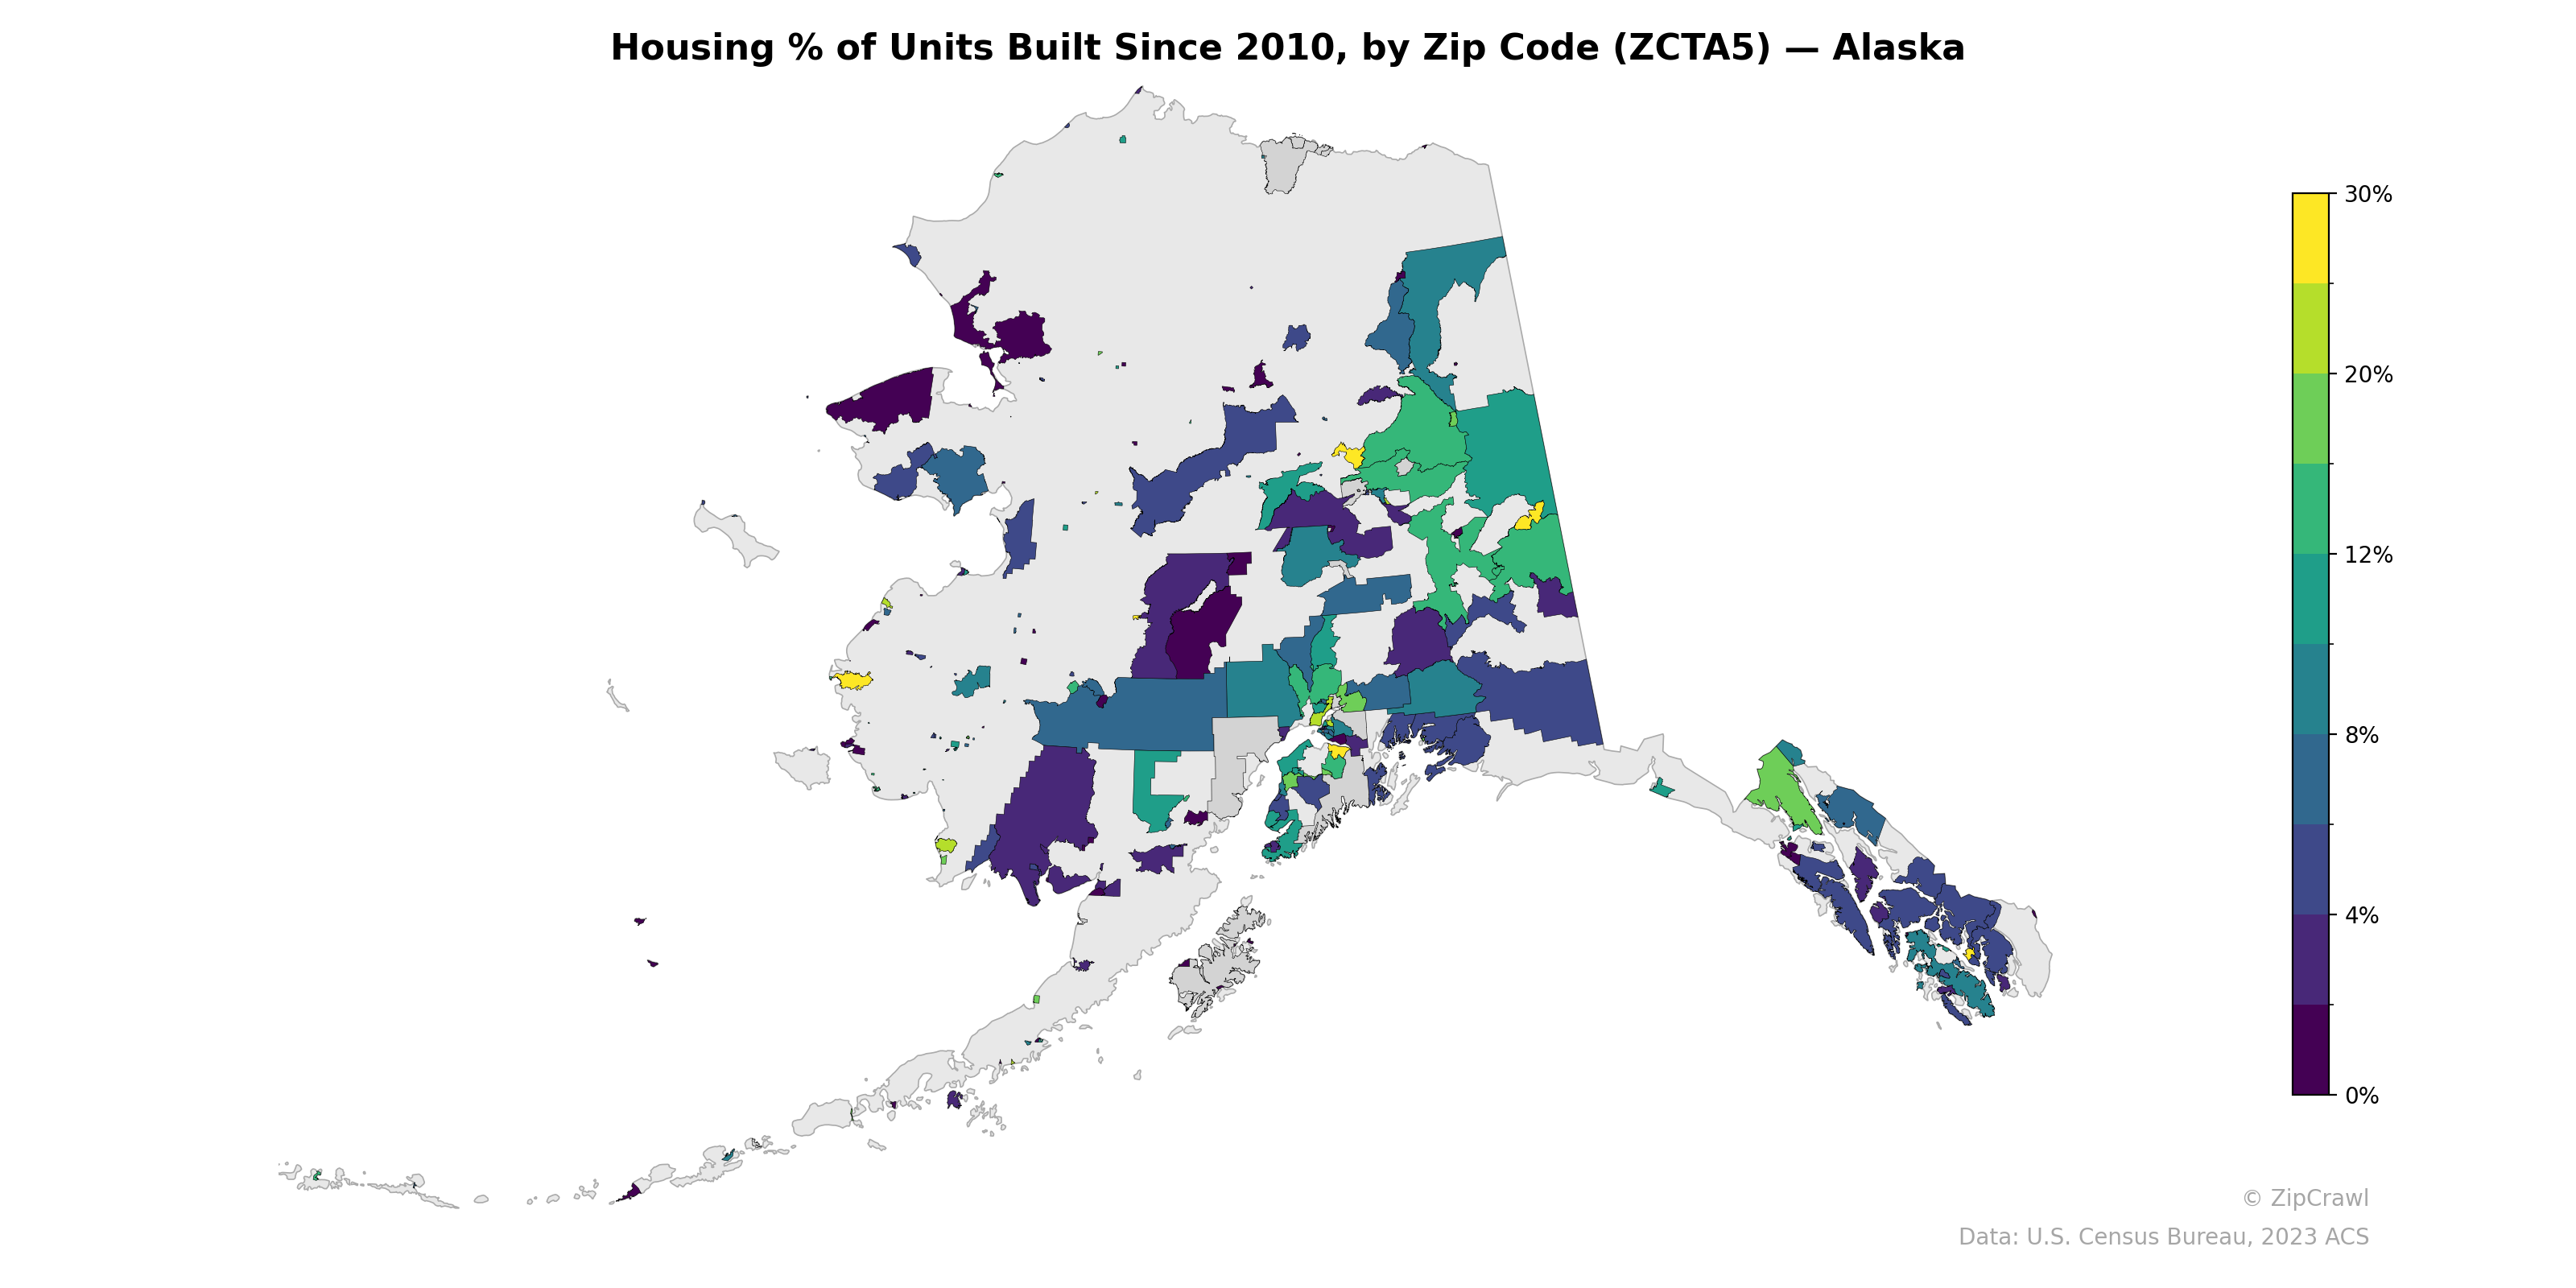
Interior and western Alaska zip codes display notably lower shares of post-2010 housing construction, with many areas falling below 4%, reflecting limited new development in remote and rural regions. The highest concentrations of recent building activity, reaching 20–30%, appear in select zip codes within the Fairbanks North Star Borough and the Matanuska-Susitna Valley north of Anchorage, consistent with those areas' sustained population growth. Southeast Alaska's panhandle shows a patchwork of low-to-moderate construction rates, with most zip codes clustered below 8%, suggesting relatively stagnant housing development compared to the state's urban growth corridors.
Data: U.S. Census Bureau, 2023 ACS
Explore
- Married Couple (% of all Households) by Zip Code (ZCTA5) — New York
- Housing Median Monthly Rent ($), by Zip Code (ZCTA5) — Alaska
- Housing Owner-Occupied % of Units, by Zip Code (ZCTA5) — Alaska
- % of Households with Broadband Internet, by Zip Code (ZCTA5) — Alaska
- Population Non-Hispanic American Indian % by Zip Code (ZCTA5) — Alaska
- Household Average Size by Zip Code (ZCTA5) — Alaska
- Housing Owner-Occupied Median Value ($), by Zip Code (ZCTA5) — Alaska
- % of Population without Health Insurance, by Zip Code (ZCTA5) — Alaska
- High School Graduate (% of Over 25) by Zip Code (ZCTA5) — Alaska
- Bachelor's Degree or Higher (% of Over 25) by Zip Code (ZCTA5) — Alaska
- Household Average Size by County
- Population Non-Hispanic American Indian % by Zip Code (ZCTA5) — Maryland
- Household Average Size by Zip Code (ZCTA5) — New York
- % of Population without Health Insurance, by Zip Code (ZCTA5) — New York
- Housing Owner-Occupied % of Units, by Zip Code (ZCTA5) — New York
- % of Households with Broadband Internet, by Zip Code (ZCTA5) — New York
- Housing Owner-Occupied Median Value ($), by Zip Code (ZCTA5) — New York
- Population Non-Hispanic American Indian % by Zip Code (ZCTA5) — Pennsylvania
- Housing Vacancy Rate by Zip Code (ZCTA5) — New York
- Bachelor's Degree or Higher (% of Over 25) by Zip Code (ZCTA5) — New York
- Housing Median Monthly Rent ($), by Zip Code (ZCTA5) — New York
- Population Non-Hispanic American Indian % by Zip Code (ZCTA5) — Rhode Island
- High School Graduate (% of Over 25) by Zip Code (ZCTA5) — Rhode Island
- Housing Vacancy Rate by Zip Code (ZCTA5) — Rhode Island
- Population Hispanic % by Zip Code (ZCTA5) — Oregon
- Bachelor's Degree or Higher (% of Over 25) by Zip Code (ZCTA5) — Rhode Island
- Population Non-Hispanic American Indian % by Zip Code (ZCTA5) — North Dakota
- Housing Vacancy Rate by Zip Code (ZCTA5) — Alaska
- Population Non-Hispanic Black % by Zip Code (ZCTA5) — North Dakota
- Married Couple (% of all Households) by Zip Code (ZCTA5) — Rhode Island
- Housing % of Units Built Since 2010, by Zip Code (ZCTA5) — Alabama
- Housing % of Units Built Since 2010, by Zip Code (ZCTA5) — Nebraska
- Housing % of Units Built Since 2010, by Zip Code (ZCTA5) — Ohio
- Housing % of Units Built Since 2010, by Zip Code (ZCTA5) — Utah
- Housing % of Units Built Since 2010, by Zip Code (ZCTA5) — Iowa
- Housing % of Units Built Since 2010, by Zip Code (ZCTA5) — Arizona
- Housing % of Units Built Since 2010, by Zip Code (ZCTA5) — Texas
- Housing % of Units Built Since 2010, by Zip Code (ZCTA5) — Oregon
- Housing % of Units Built Since 2010, by Zip Code (ZCTA5) — Idaho
- Housing % of Units Built Since 2010, by Zip Code (ZCTA5) — Hawaii