NOTE: Gray indicates insufficient data or a suppressed estimate.
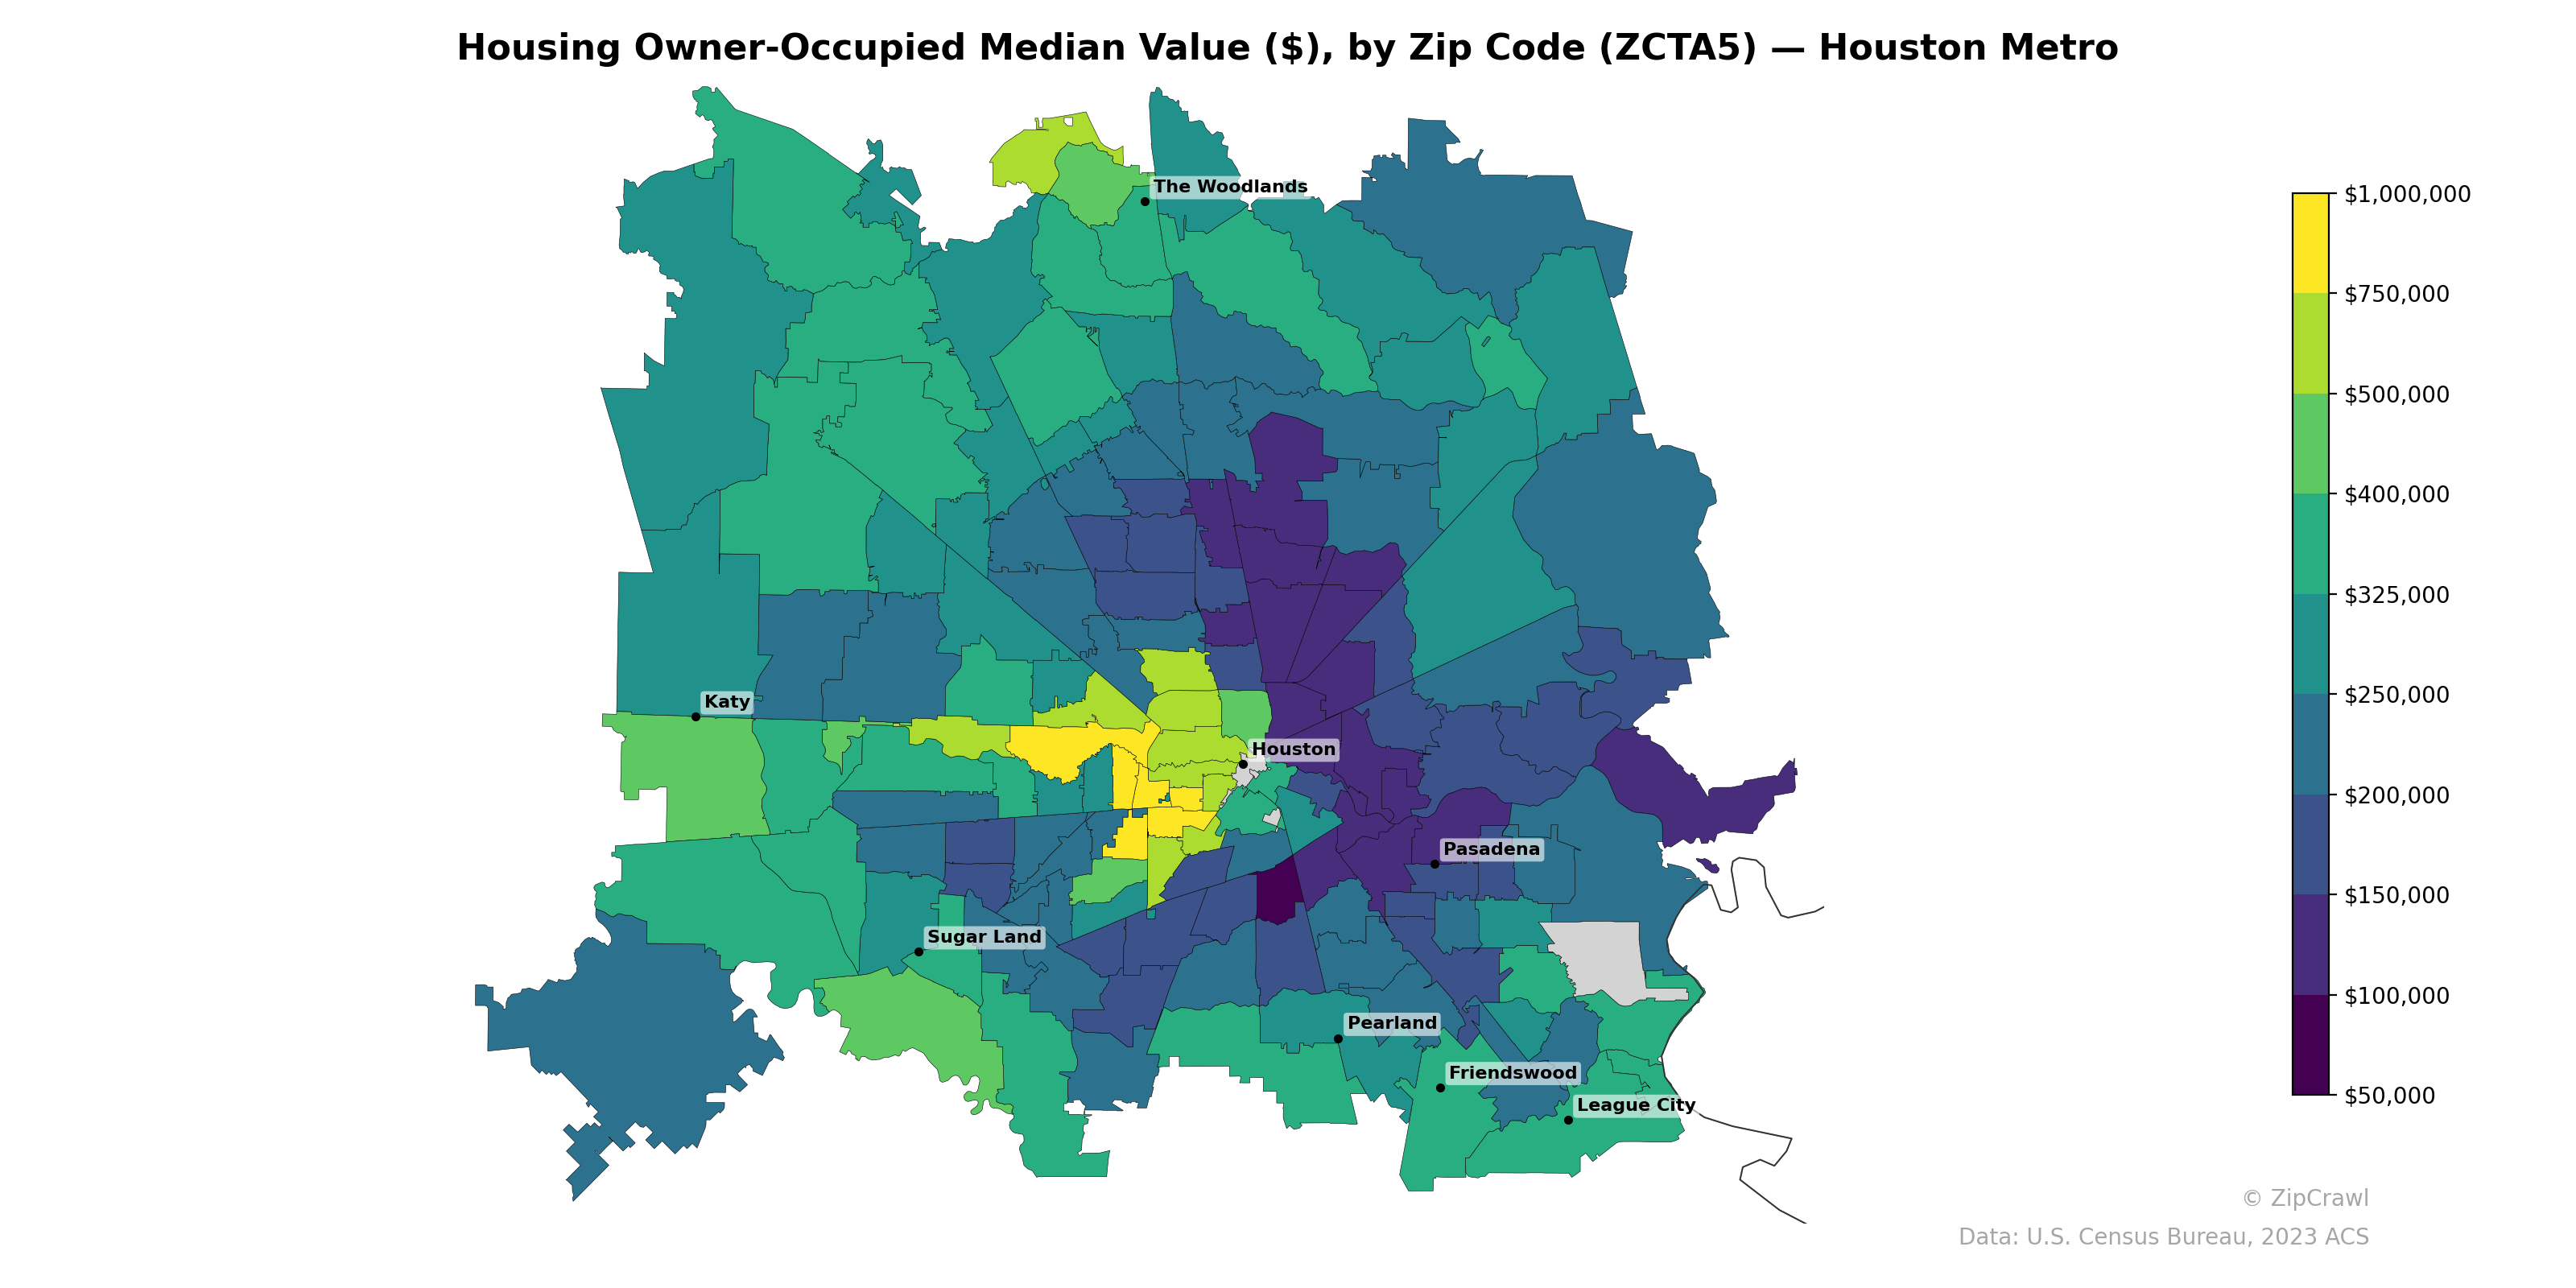
The highest median home values in the Houston metro, exceeding $500,000 and approaching $1,000,000, concentrate in a distinct west-to-southwest corridor running through the inner loop neighborhoods west of downtown Houston, with additional pockets near The Woodlands and Sugar Land. A stark contrast emerges between these affluent zones and the significantly lower-value areas to the east and southeast, particularly around Pasadena and the ship channel industrial corridor, where median values frequently fall below $150,000. Outer suburban zip codes in all directions generally cluster in the $200,000–$350,000 range, forming a mid-value ring that separates the high-value inner-west and northwest suburbs from the lower-value eastern portions of the metro.
Data: U.S. Census Bureau, 2023 ACS
Explore
- Population Non-Hispanic American Indian % by Zip Code (ZCTA5) — New York Metro
- Housing Vacancy Rate by Zip Code (ZCTA5) — Houston Metro
- Bachelor's Degree or Higher (% of Over 25) by Zip Code (ZCTA5) — Houston Metro
- Housing Owner-Occupied % of Units, by Zip Code (ZCTA5) — Houston Metro
- Married Couple (% of all Households) by Zip Code (ZCTA5) — Houston Metro
- Household Average Size by Zip Code (ZCTA5) — Houston Metro
- Housing Median Monthly Rent ($), by Zip Code (ZCTA5) — Houston Metro
- % of Households with Broadband Internet, by Zip Code (ZCTA5) — Houston Metro
- Housing % of Units Built Since 2010, by Zip Code (ZCTA5) — Houston Metro
- % of Population without Health Insurance, by Zip Code (ZCTA5) — Houston Metro
- U.S. Citizens (% of Population Over 18) by Zip Code (ZCTA5) — Arkansas
- Median Age by County
- U.S. Citizens (% of Population Over 18) by Zip Code (ZCTA5) — New York Metro
- Population Hispanic % by Zip Code (ZCTA5) — New York Metro
- Population Non-Hispanic White % by Zip Code (ZCTA5) — New York Metro
- High School Graduate (% of Over 25) by Zip Code (ZCTA5) — New York Metro
- % of Population on Food Stamps or SNAP (Last 12 Months), by County
- Median Age by Zip Code (ZCTA5) — New York Metro
- Population Non-Hispanic Black % by Zip Code (ZCTA5) — New York Metro
- Bachelor's Degree or Higher (% of Over 25) by Zip Code (ZCTA5) — New York Metro
- Household Median Income by Zip Code (ZCTA5) — New York Metro
- % of Population without Health Insurance, by Zip Code (ZCTA5) — Ohio
- Bachelor's Degree or Higher (% of Over 25) by Zip Code (ZCTA5) — Ohio
- Housing Owner-Occupied % of Units, by Zip Code (ZCTA5) — Ohio
- Population Non-Hispanic White % by Zip Code (ZCTA5) — Ohio
- Median Age by Zip Code (ZCTA5) — Ohio
- Population Non-Hispanic American Indian % by Zip Code (ZCTA5) — Ohio
- High School Graduate (% of Over 25) by Zip Code (ZCTA5) — Ohio
- % of Households with Broadband Internet, by Zip Code (ZCTA5) — Ohio
- Population Hispanic % by Zip Code (ZCTA5) — Ohio
- Housing Owner-Occupied Median Value ($), by Zip Code (ZCTA5) — Boston Metro
- Housing Owner-Occupied Median Value ($), by Zip Code (ZCTA5) — Austin Metro
- Housing Owner-Occupied Median Value ($), by Zip Code (ZCTA5) — Miami Metro
- Housing Owner-Occupied Median Value ($), by Zip Code (ZCTA5) — Detroit Metro
- Housing Owner-Occupied Median Value ($), by Zip Code (ZCTA5) — Tampa Metro
- Housing Owner-Occupied Median Value ($), by Zip Code (ZCTA5) — Denver Metro
- Housing Owner-Occupied Median Value ($), by Zip Code (ZCTA5) — Chicago Metro
- Housing Owner-Occupied Median Value ($), by Zip Code (ZCTA5) — Orlando Metro
- Housing Owner-Occupied Median Value ($), by Zip Code (ZCTA5) — Dallas Metro
- Housing Owner-Occupied Median Value ($), by Zip Code (ZCTA5) — Phoenix Metro