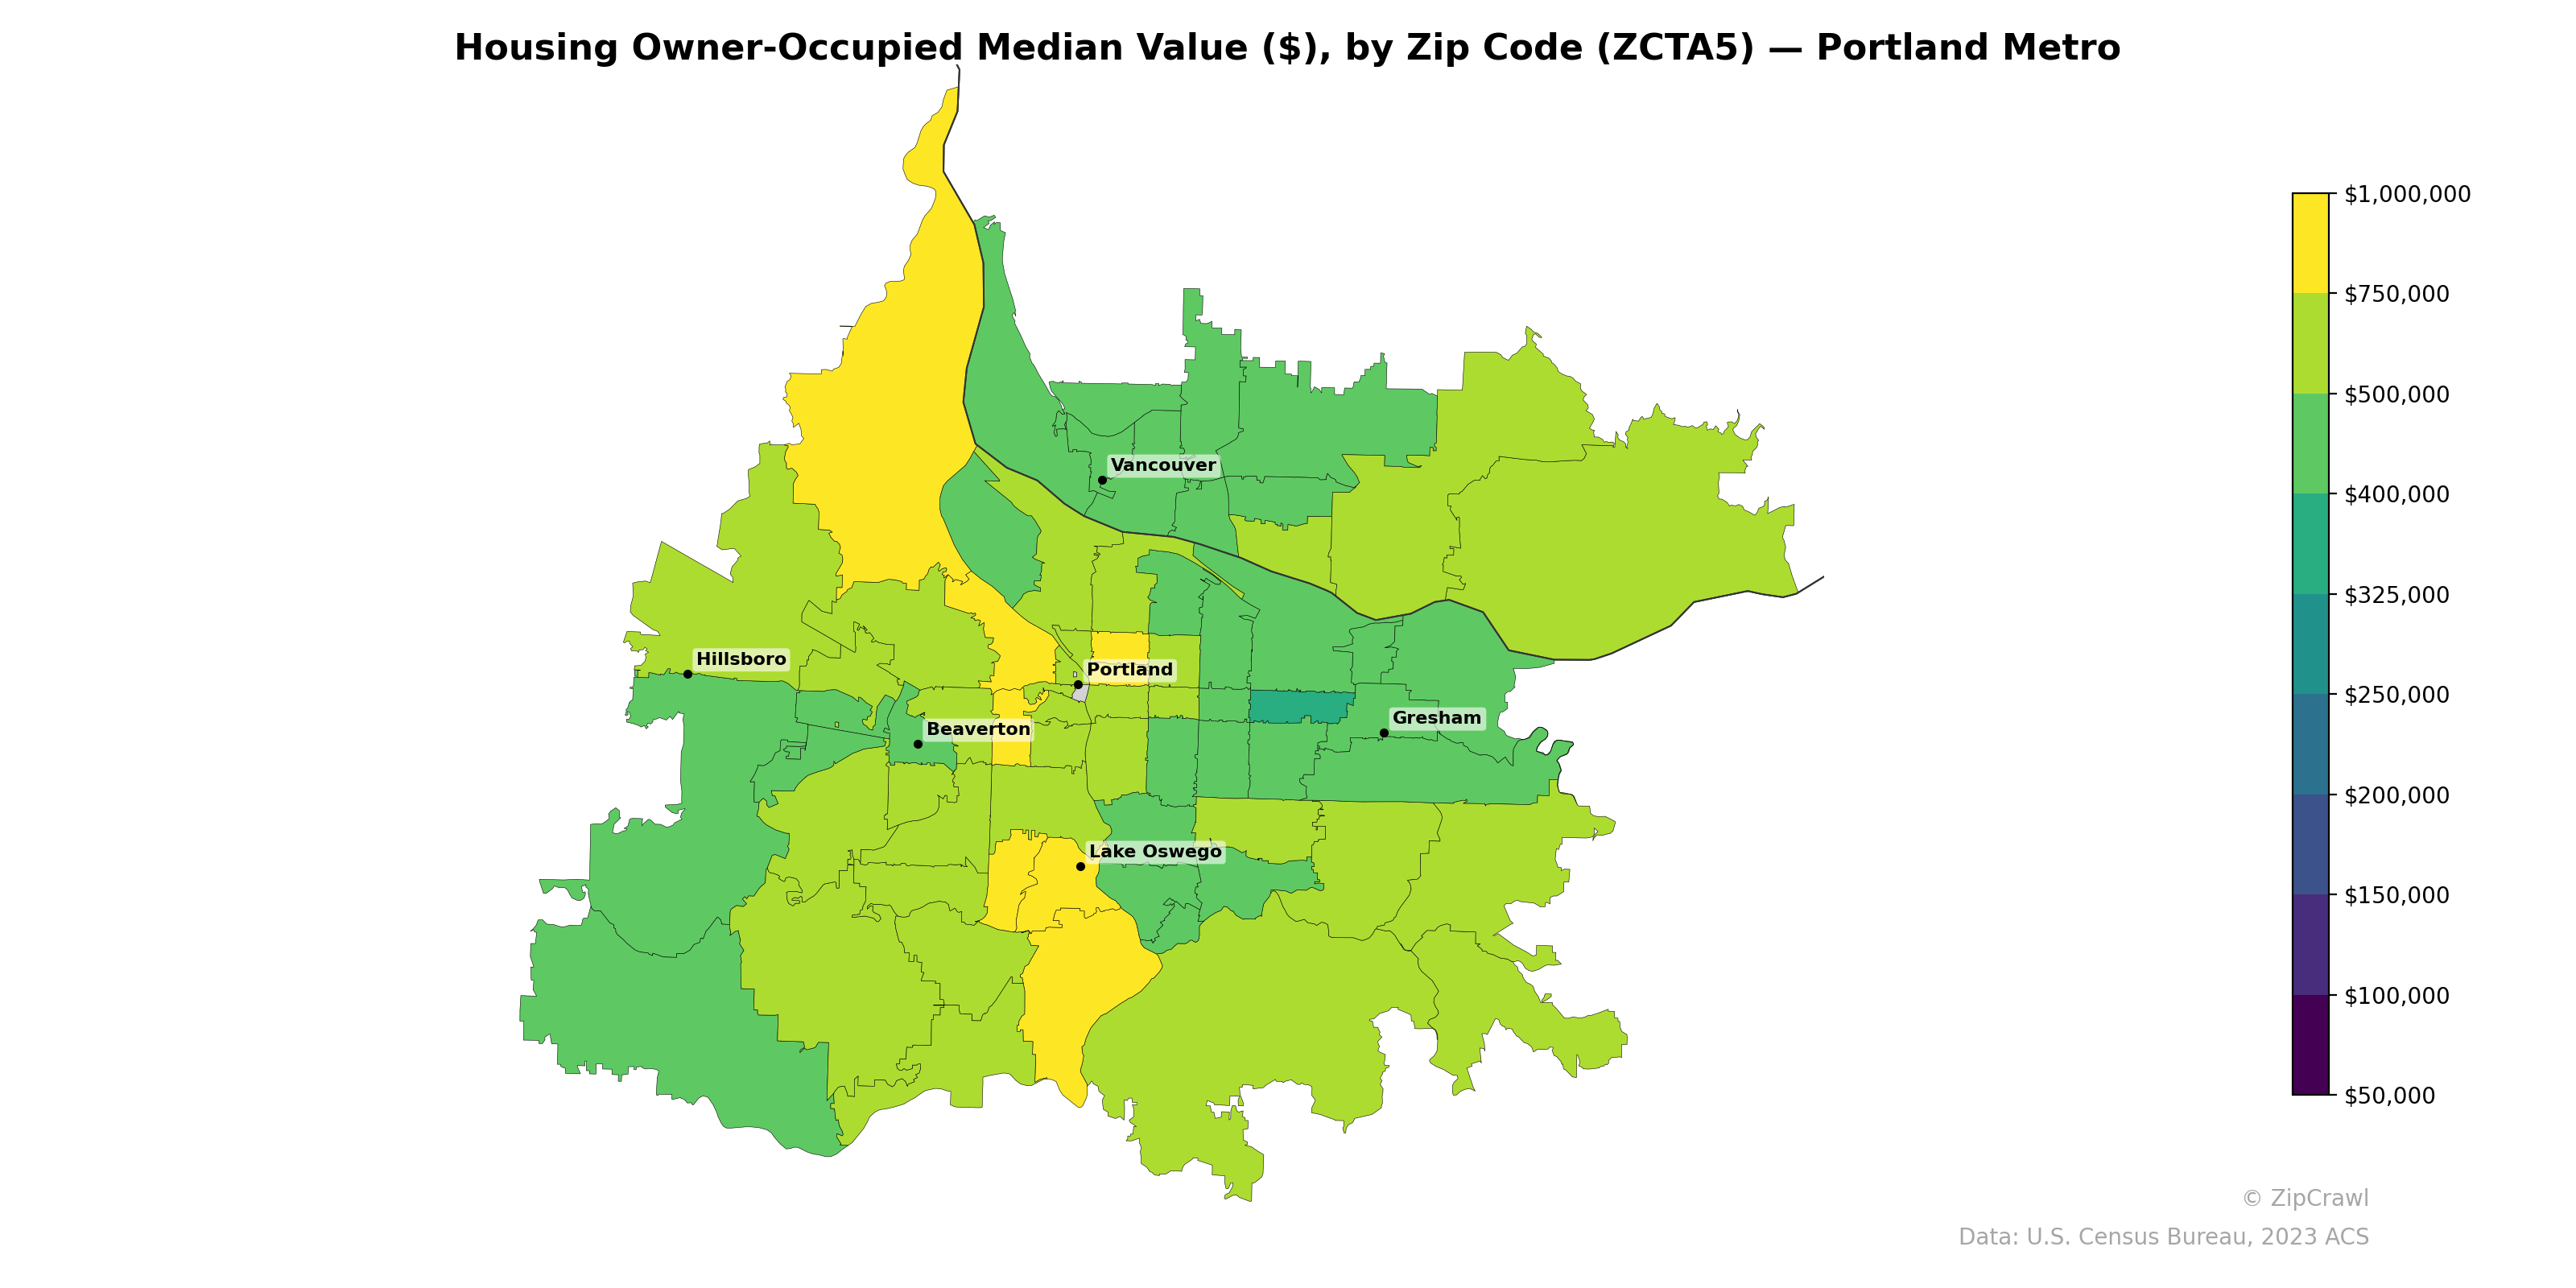
NOTE: Gray indicates insufficient data or a suppressed estimate.
The highest median home values, exceeding $750,000, cluster in the northwest hills of Portland, the Lake Oswego corridor, and parts of the West Linn area to the south, while a secondary premium pocket appears near the northern tip of the metro along the Columbia River. Median values decline notably moving eastward, with Gresham and outer east Portland zip codes generally falling in the $325,000–$400,000 range, representing the most affordable owner-occupied housing within the metro boundary. Vancouver's zip codes on the Washington side display moderate values largely in the $350,000–$450,000 range, positioning them between the premium west-side Oregon suburbs and the lower-cost eastern reaches of the metro.
Data: U.S. Census Bureau, 2023 ACS
Explore
- High School Graduate (% of Over 25) by Zip Code (ZCTA5) — Texas
- Household Average Size by Zip Code (ZCTA5) — Portland Metro
- % of Households with Broadband Internet, by Zip Code (ZCTA5) — Portland Metro
- Married Couple (% of all Households) by Zip Code (ZCTA5) — Portland Metro
- Bachelor's Degree or Higher (% of Over 25) by Zip Code (ZCTA5) — Portland Metro
- Housing Median Monthly Rent ($), by Zip Code (ZCTA5) — Portland Metro
- Housing Owner-Occupied % of Units, by Zip Code (ZCTA5) — Portland Metro
- Housing Vacancy Rate by Zip Code (ZCTA5) — Portland Metro
- % of Population without Health Insurance, by Zip Code (ZCTA5) — Portland Metro
- Housing % of Units Built Since 2010, by Zip Code (ZCTA5) — Portland Metro
- High School Graduate (% of Over 25) by County
- U.S. Citizens (% of Population Over 18) by Zip Code (ZCTA5) — Texas
- Population Non-Hispanic White % by Zip Code (ZCTA5) — Texas
- Population Non-Hispanic Asian % by Zip Code (ZCTA5) — Chicago Metro
- % of Population on Food Stamps or SNAP (Last 12 Months), by Zip Code (ZCTA5) — Chicago Metro
- Household Median Income by Zip Code (ZCTA5) — Texas
- Population Non-Hispanic Black % by Zip Code (ZCTA5) — Texas
- Population Hispanic % by Zip Code (ZCTA5) — Texas
- Population Non-Hispanic American Indian % by Zip Code (ZCTA5) — Texas
- Median Age by Zip Code (ZCTA5) — Texas
- % of Households with Broadband Internet, by Zip Code (ZCTA5) — Baltimore Metro
- Bachelor's Degree or Higher (% of Over 25) by Zip Code (ZCTA5) — Baltimore Metro
- % of Population without Health Insurance, by Zip Code (ZCTA5) — Baltimore Metro
- Population Non-Hispanic Asian % by Zip Code (ZCTA5) — Charlotte Metro
- Population Non-Hispanic Asian % by Zip Code (ZCTA5) — Baltimore Metro
- % of Population on Food Stamps or SNAP (Last 12 Months), by Zip Code (ZCTA5) — Charlotte Metro
- Household Median Income by Zip Code (ZCTA5) — Baltimore Metro
- High School Graduate (% of Over 25) by Zip Code (ZCTA5) — Baltimore Metro
- Population Non-Hispanic Black % by Zip Code (ZCTA5) — Baltimore Metro
- Married Couple (% of all Households) by Zip Code (ZCTA5) — Austin Metro
- Housing Owner-Occupied Median Value ($), by Zip Code (ZCTA5) — Orlando Metro
- Housing Owner-Occupied Median Value ($), by Zip Code (ZCTA5) — Atlanta Metro
- Housing Owner-Occupied Median Value ($), by Zip Code (ZCTA5) — Houston Metro
- Housing Owner-Occupied Median Value ($), by Zip Code (ZCTA5) — Miami Metro
- Housing Owner-Occupied Median Value ($), by Zip Code (ZCTA5) — Phoenix Metro
- Housing Owner-Occupied Median Value ($), by Zip Code (ZCTA5) — Tampa Metro
- Housing Owner-Occupied Median Value ($), by Zip Code (ZCTA5) — Boston Metro
- Housing Owner-Occupied Median Value ($), by Zip Code (ZCTA5) — Detroit Metro
- Housing Owner-Occupied Median Value ($), by Zip Code (ZCTA5) — Denver Metro
- Housing Owner-Occupied Median Value ($), by Zip Code (ZCTA5) — Maryland