NOTE: Gray indicates insufficient data or a suppressed estimate.
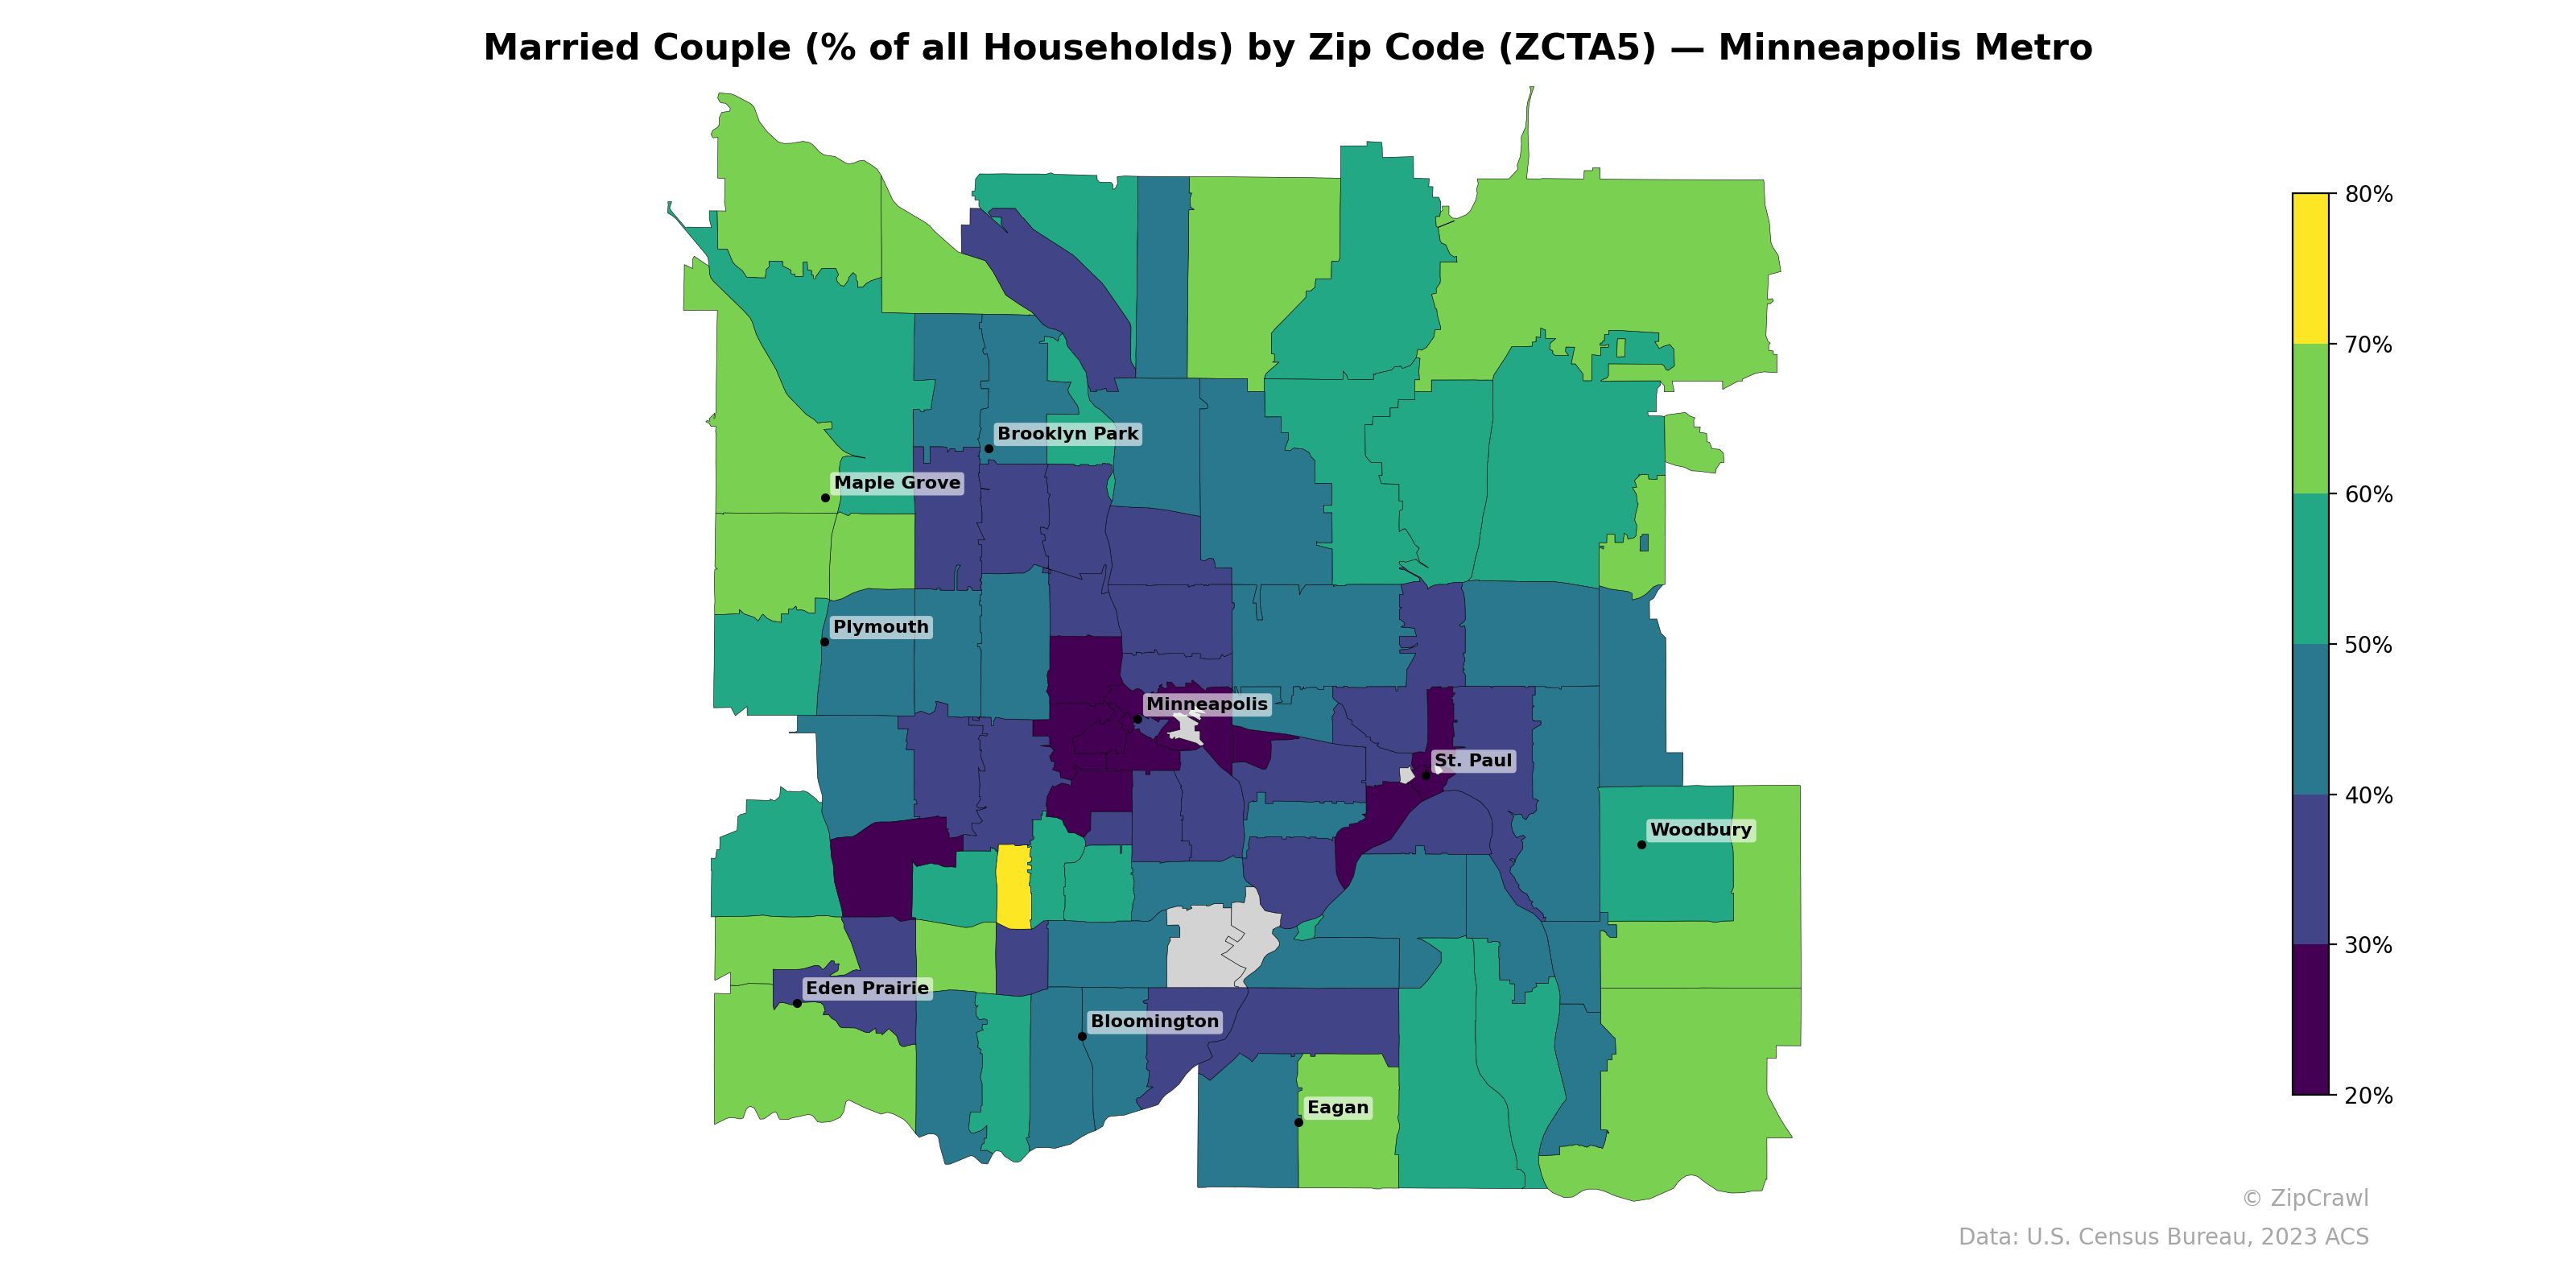
Married-couple households concentrate most heavily in the outer suburban ring, with zip codes in Maple Grove, Woodbury, Eden Prairie, and the far northern and northwestern periphery consistently exceeding 60%, while several exurban pockets reach above 75%. The urban core of Minneapolis and portions of central St. Paul form a distinct low-percentage cluster, with many zip codes falling below 30%, reflecting higher shares of single-person and non-family households typical of dense, renter-heavy neighborhoods. A sharp gradient is visible along the western corridor from downtown Minneapolis outward toward Plymouth and Eden Prairie, where married-couple rates roughly double within just a few zip code boundaries.
Data: U.S. Census Bureau, 2023 ACS
Explore
- High School Graduate (% of Over 25) by Zip Code (ZCTA5) — Chicago Metro
- Household Average Size by Zip Code (ZCTA5) — Minneapolis Metro
- % of Population without Health Insurance, by Zip Code (ZCTA5) — Minneapolis Metro
- Housing Vacancy Rate by Zip Code (ZCTA5) — Minneapolis Metro
- Housing % of Units Built Since 2010, by Zip Code (ZCTA5) — Minneapolis Metro
- Housing Owner-Occupied Median Value ($), by Zip Code (ZCTA5) — Minneapolis Metro
- Housing Owner-Occupied % of Units, by Zip Code (ZCTA5) — Minneapolis Metro
- Bachelor's Degree or Higher (% of Over 25) by Zip Code (ZCTA5) — Minneapolis Metro
- Housing Median Monthly Rent ($), by Zip Code (ZCTA5) — Minneapolis Metro
- % of Households with Broadband Internet, by Zip Code (ZCTA5) — Minneapolis Metro
- % of Population without Health Insurance, by County
- U.S. Citizens (% of Population Over 18) by Zip Code (ZCTA5) — Chicago Metro
- % of Population on Food Stamps or SNAP (Last 12 Months), by Zip Code (ZCTA5) — Los Angeles Metro
- Household Median Income by Zip Code (ZCTA5) — Chicago Metro
- Population Non-Hispanic Asian % by Zip Code (ZCTA5) — Los Angeles Metro
- Median Age by Zip Code (ZCTA5) — Chicago Metro
- Population Hispanic % by Zip Code (ZCTA5) — Chicago Metro
- Population Non-Hispanic Black % by Zip Code (ZCTA5) — Chicago Metro
- Population Non-Hispanic White % by Zip Code (ZCTA5) — Chicago Metro
- Population Non-Hispanic American Indian % by Zip Code (ZCTA5) — Chicago Metro
- % of Population without Health Insurance, by Zip Code (ZCTA5) — Boston Metro
- Bachelor's Degree or Higher (% of Over 25) by Zip Code (ZCTA5) — Boston Metro
- Housing Owner-Occupied % of Units, by Zip Code (ZCTA5) — Boston Metro
- Median Age by Zip Code (ZCTA5) — Boston Metro
- Household Median Income by Zip Code (ZCTA5) — Boston Metro
- Population Non-Hispanic White % by Zip Code (ZCTA5) — Boston Metro
- Population Non-Hispanic Black % by Zip Code (ZCTA5) — Boston Metro
- Population Non-Hispanic American Indian % by Zip Code (ZCTA5) — Boston Metro
- % of Households with Broadband Internet, by Zip Code (ZCTA5) — Boston Metro
- Housing Owner-Occupied % of Units, by Zip Code (ZCTA5) — Seattle Metro
- Married Couple (% of all Households) by Zip Code (ZCTA5) — Miami Metro
- Married Couple (% of all Households) by Zip Code (ZCTA5) — Houston Metro
- Married Couple (% of all Households) by Zip Code (ZCTA5) — Dallas Metro
- Married Couple (% of all Households) by Zip Code (ZCTA5) — Detroit Metro
- Married Couple (% of all Households) by Zip Code (ZCTA5) — Boston Metro
- Married Couple (% of all Households) by Zip Code (ZCTA5) — Austin Metro
- Married Couple (% of all Households) by Zip Code (ZCTA5) — Tampa Metro
- Married Couple (% of all Households) by Zip Code (ZCTA5) — Minnesota
- Married Couple (% of all Households) by Zip Code (ZCTA5) — St. Louis Metro
- Married Couple (% of all Households) by Zip Code (ZCTA5) — Chicago Metro