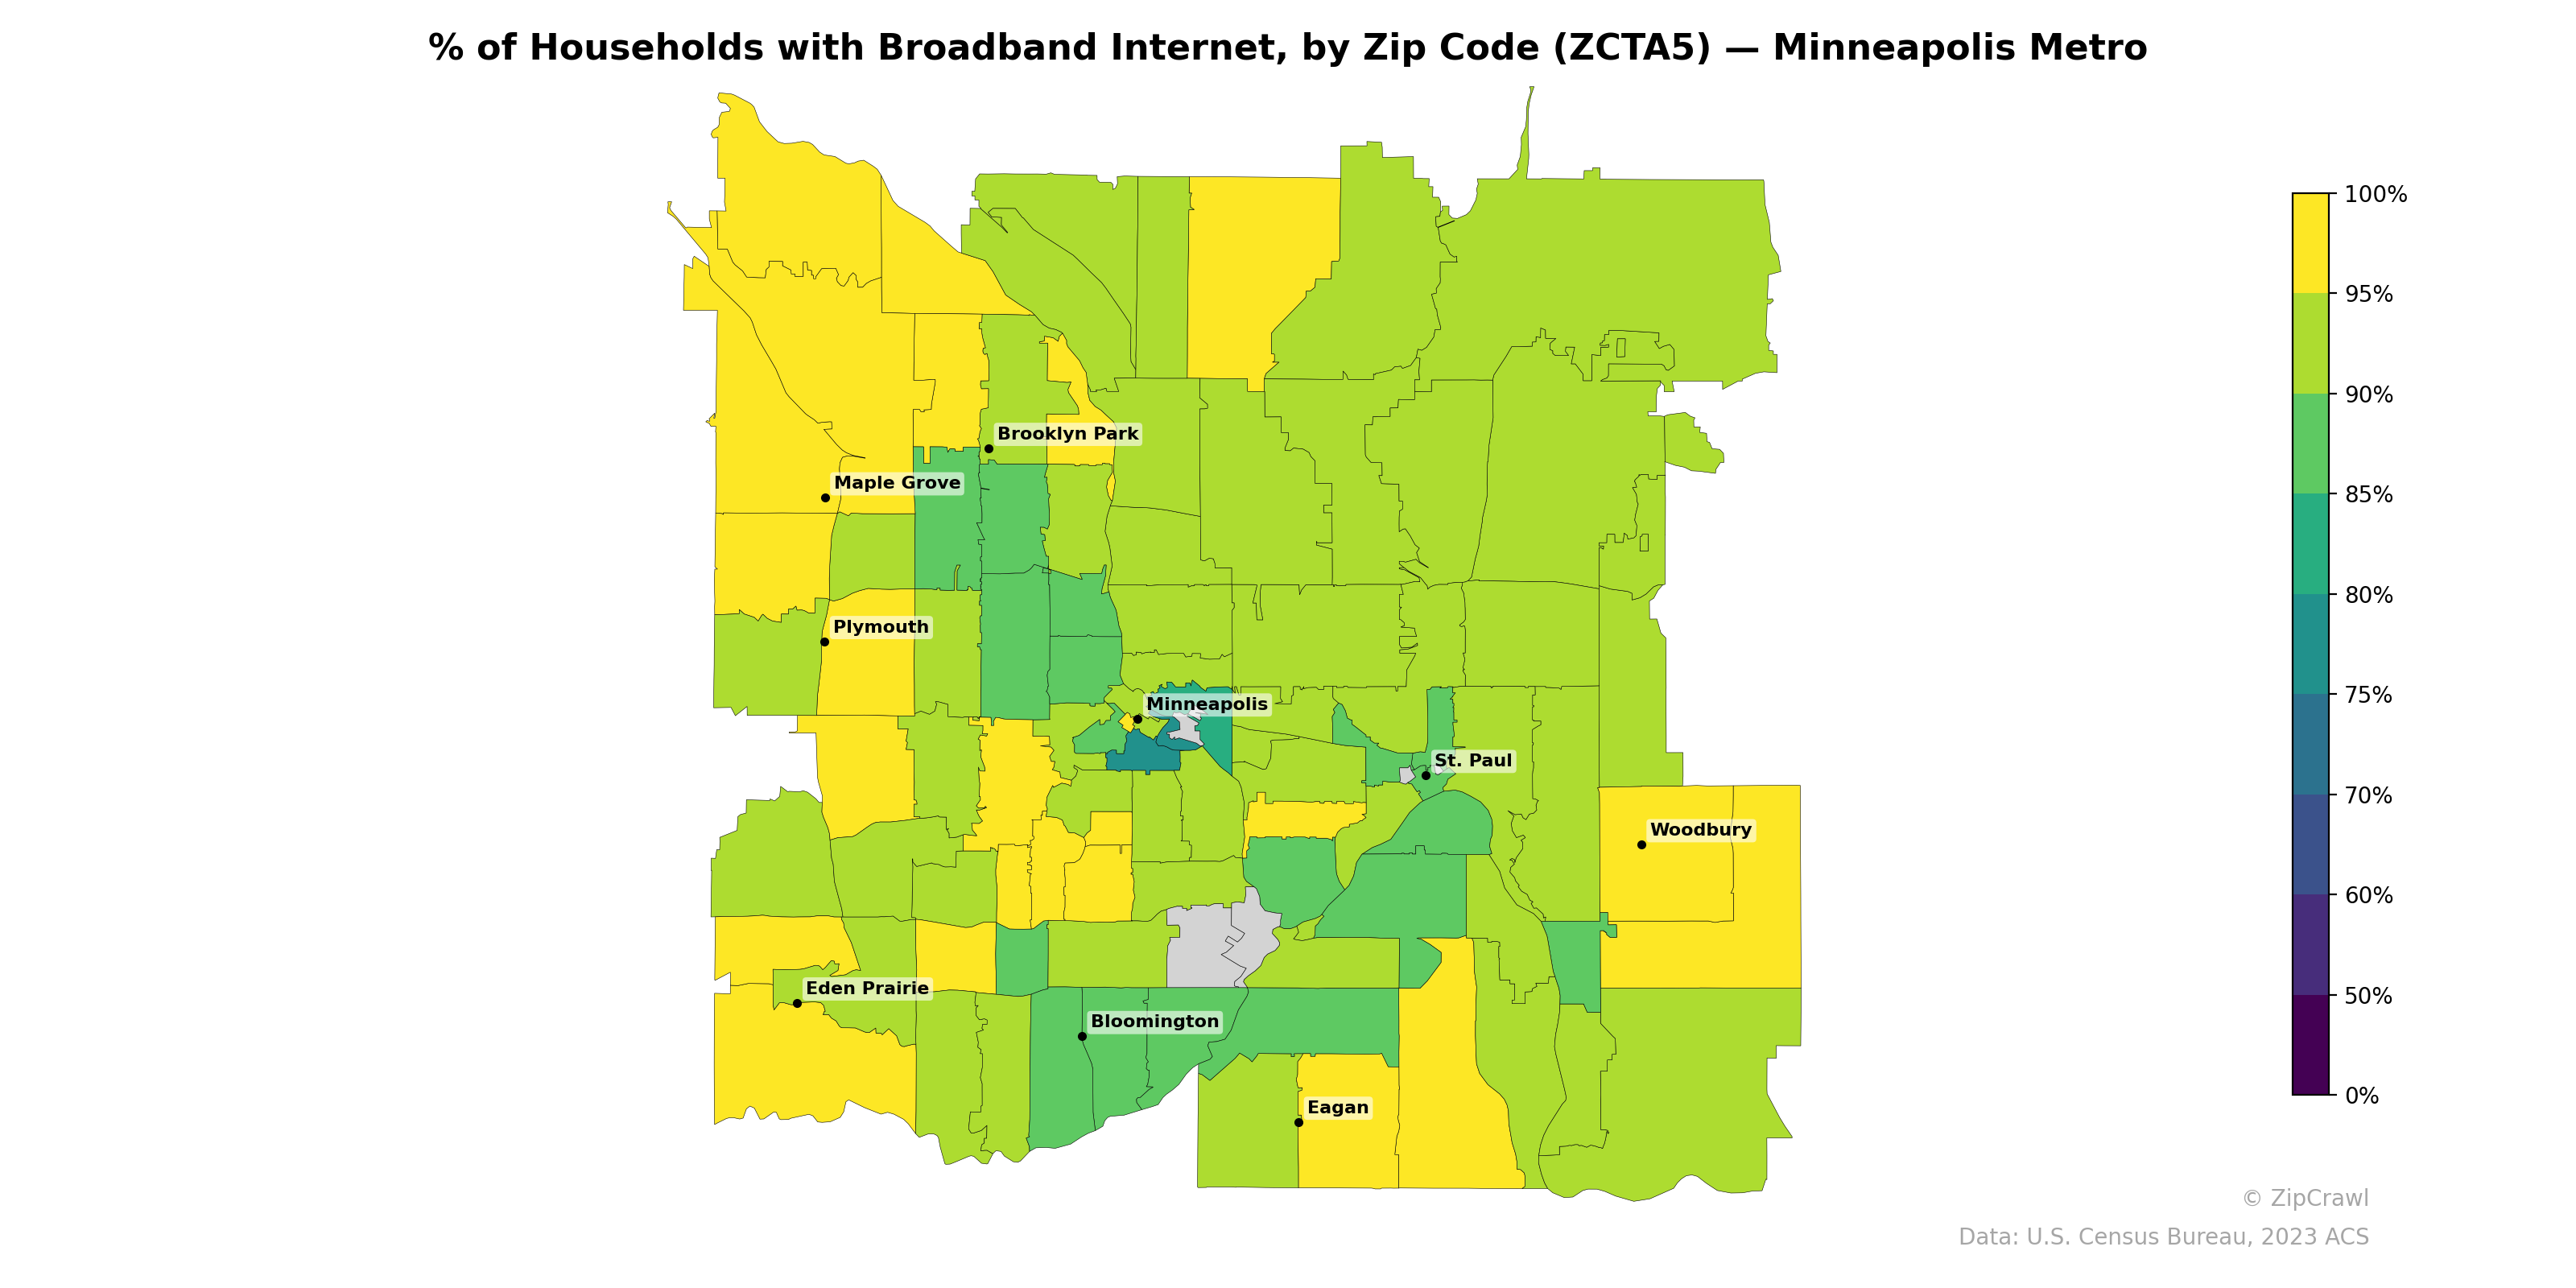
NOTE: Gray indicates insufficient data or a suppressed estimate.
Broadband adoption rates across the Minneapolis metro are generally high, with most suburban zip codes in areas like Maple Grove, Eden Prairie, Woodbury, and Eagan reaching 90–100%, reflected in the dominant yellow shading across the periphery. A notable digital divide emerges in the urban core, where zip codes in and immediately surrounding downtown Minneapolis display markedly lower broadband penetration in the 60–75% range, appearing as a teal-green cluster amid otherwise well-connected surroundings. Parts of Brooklyn Park and several zip codes along the northern corridor between Minneapolis and the outer suburbs also show moderately depressed rates compared to their neighbors, suggesting pockets of connectivity gaps that align with known demographic and income disparities in the region.
Data: U.S. Census Bureau, 2023 ACS
Explore
- High School Graduate (% of Over 25) by Zip Code (ZCTA5) — Chicago Metro
- Married Couple (% of all Households) by Zip Code (ZCTA5) — Minneapolis Metro
- Bachelor's Degree or Higher (% of Over 25) by Zip Code (ZCTA5) — Minneapolis Metro
- % of Population without Health Insurance, by Zip Code (ZCTA5) — Minneapolis Metro
- Household Average Size by Zip Code (ZCTA5) — Minneapolis Metro
- Housing Median Monthly Rent ($), by Zip Code (ZCTA5) — Minneapolis Metro
- Housing Owner-Occupied Median Value ($), by Zip Code (ZCTA5) — Minneapolis Metro
- Housing Owner-Occupied % of Units, by Zip Code (ZCTA5) — Minneapolis Metro
- Housing % of Units Built Since 2010, by Zip Code (ZCTA5) — Minneapolis Metro
- Housing Vacancy Rate by Zip Code (ZCTA5) — Minneapolis Metro
- % of Population without Health Insurance, by County
- Household Median Income by Zip Code (ZCTA5) — Chicago Metro
- U.S. Citizens (% of Population Over 18) by Zip Code (ZCTA5) — Chicago Metro
- Median Age by Zip Code (ZCTA5) — Chicago Metro
- % of Population on Food Stamps or SNAP (Last 12 Months), by Zip Code (ZCTA5) — Los Angeles Metro
- Population Non-Hispanic White % by Zip Code (ZCTA5) — Chicago Metro
- Population Non-Hispanic Black % by Zip Code (ZCTA5) — Chicago Metro
- Population Hispanic % by Zip Code (ZCTA5) — Chicago Metro
- Population Non-Hispanic American Indian % by Zip Code (ZCTA5) — Chicago Metro
- Population Non-Hispanic Asian % by Zip Code (ZCTA5) — Los Angeles Metro
- Housing Owner-Occupied Median Value ($), by Zip Code (ZCTA5) — Boston Metro
- % of Population without Health Insurance, by Zip Code (ZCTA5) — Boston Metro
- Housing Median Monthly Rent ($), by Zip Code (ZCTA5) — Boston Metro
- Population Non-Hispanic White % by Zip Code (ZCTA5) — Boston Metro
- Median Age by Zip Code (ZCTA5) — Boston Metro
- Population Hispanic % by Zip Code (ZCTA5) — Boston Metro
- Population Non-Hispanic American Indian % by Zip Code (ZCTA5) — Boston Metro
- Bachelor's Degree or Higher (% of Over 25) by Zip Code (ZCTA5) — Boston Metro
- Housing Owner-Occupied % of Units, by Zip Code (ZCTA5) — Boston Metro
- U.S. Citizens (% of Population Over 18) by Zip Code (ZCTA5) — Boston Metro
- % of Households with Broadband Internet, by Zip Code (ZCTA5) — Miami Metro
- % of Households with Broadband Internet, by Zip Code (ZCTA5) — Houston Metro
- % of Households with Broadband Internet, by Zip Code (ZCTA5) — Tampa Metro
- % of Households with Broadband Internet, by Zip Code (ZCTA5) — Detroit Metro
- % of Households with Broadband Internet, by Zip Code (ZCTA5) — Orlando Metro
- % of Households with Broadband Internet, by Zip Code (ZCTA5) — Boston Metro
- % of Households with Broadband Internet, by Zip Code (ZCTA5) — Minnesota
- % of Households with Broadband Internet, by Zip Code (ZCTA5) — St. Louis Metro
- % of Households with Broadband Internet, by Zip Code (ZCTA5) — Chicago Metro
- % of Households with Broadband Internet, by Zip Code (ZCTA5) — Denver Metro