NOTE: Gray indicates insufficient data or a suppressed estimate.
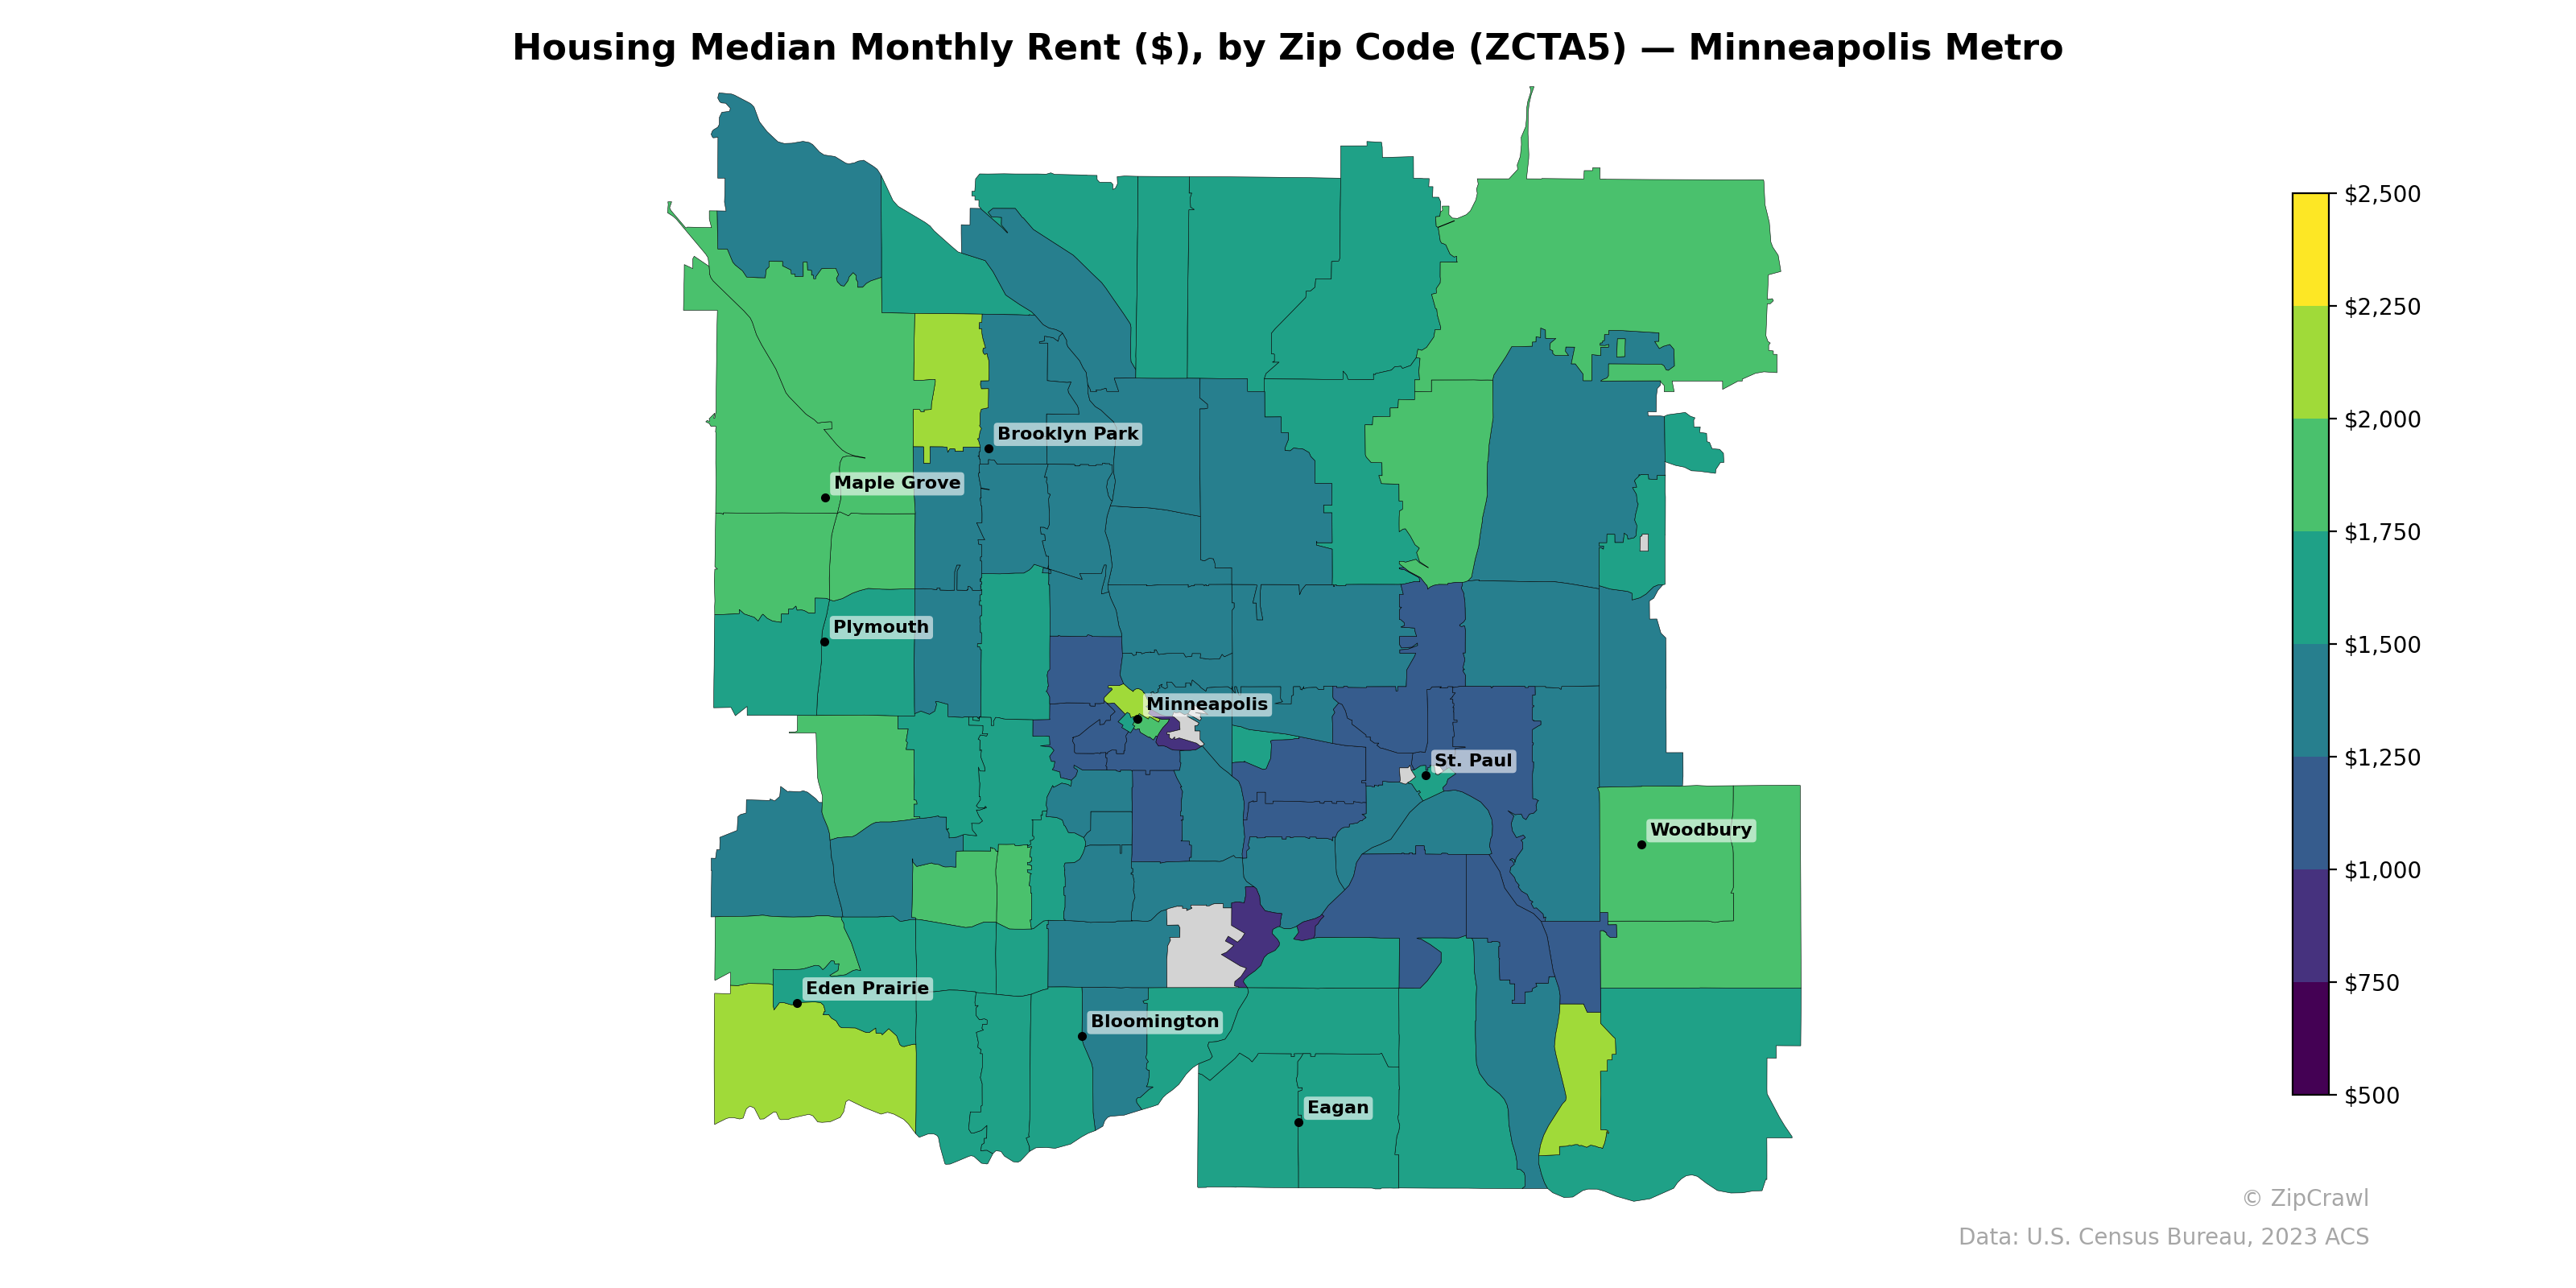
Median monthly rents in the Minneapolis metro peak above $2,000 in suburban western and northwestern zip codes—particularly around Maple Grove, Plymouth, and Eden Prairie—as well as in select downtown Minneapolis zip codes, reflecting demand in both affluent suburbs and the urban core. A pronounced belt of lower rents ($500–$900) runs through north Minneapolis, portions of central St. Paul, and several south-central zip codes near Bloomington, suggesting concentrations of older or more affordable housing stock. The outer-ring suburbs to the east, including Woodbury, generally fall in the $1,250–$1,750 range, occupying a middle tier between the high-rent western suburbs and the lower-cost urban corridors.
Data: U.S. Census Bureau, 2023 ACS
Explore
- High School Graduate (% of Over 25) by Zip Code (ZCTA5) — Chicago Metro
- Married Couple (% of all Households) by Zip Code (ZCTA5) — Minneapolis Metro
- % of Population without Health Insurance, by Zip Code (ZCTA5) — Minneapolis Metro
- Housing Vacancy Rate by Zip Code (ZCTA5) — Minneapolis Metro
- Household Average Size by Zip Code (ZCTA5) — Minneapolis Metro
- Housing Owner-Occupied Median Value ($), by Zip Code (ZCTA5) — Minneapolis Metro
- Housing Owner-Occupied % of Units, by Zip Code (ZCTA5) — Minneapolis Metro
- Bachelor's Degree or Higher (% of Over 25) by Zip Code (ZCTA5) — Minneapolis Metro
- Housing % of Units Built Since 2010, by Zip Code (ZCTA5) — Minneapolis Metro
- % of Households with Broadband Internet, by Zip Code (ZCTA5) — Minneapolis Metro
- % of Population without Health Insurance, by County
- U.S. Citizens (% of Population Over 18) by Zip Code (ZCTA5) — Chicago Metro
- % of Population on Food Stamps or SNAP (Last 12 Months), by Zip Code (ZCTA5) — Los Angeles Metro
- Household Median Income by Zip Code (ZCTA5) — Chicago Metro
- Population Non-Hispanic Asian % by Zip Code (ZCTA5) — Los Angeles Metro
- Median Age by Zip Code (ZCTA5) — Chicago Metro
- Population Hispanic % by Zip Code (ZCTA5) — Chicago Metro
- Population Non-Hispanic Black % by Zip Code (ZCTA5) — Chicago Metro
- Population Non-Hispanic White % by Zip Code (ZCTA5) — Chicago Metro
- Population Non-Hispanic American Indian % by Zip Code (ZCTA5) — Chicago Metro
- % of Population without Health Insurance, by Zip Code (ZCTA5) — Boston Metro
- Bachelor's Degree or Higher (% of Over 25) by Zip Code (ZCTA5) — Boston Metro
- Housing Owner-Occupied % of Units, by Zip Code (ZCTA5) — Boston Metro
- Median Age by Zip Code (ZCTA5) — Boston Metro
- Household Median Income by Zip Code (ZCTA5) — Boston Metro
- Population Non-Hispanic White % by Zip Code (ZCTA5) — Boston Metro
- Population Non-Hispanic Black % by Zip Code (ZCTA5) — Boston Metro
- Population Non-Hispanic American Indian % by Zip Code (ZCTA5) — Boston Metro
- % of Households with Broadband Internet, by Zip Code (ZCTA5) — Boston Metro
- Housing Owner-Occupied % of Units, by Zip Code (ZCTA5) — Seattle Metro
- Housing Median Monthly Rent ($), by Zip Code (ZCTA5) — Miami Metro
- Housing Median Monthly Rent ($), by Zip Code (ZCTA5) — Houston Metro
- Housing Median Monthly Rent ($), by Zip Code (ZCTA5) — Minnesota
- Housing Median Monthly Rent ($), by Zip Code (ZCTA5) — Tampa Metro
- Housing Median Monthly Rent ($), by Zip Code (ZCTA5) — Boston Metro
- Housing Median Monthly Rent ($), by Zip Code (ZCTA5) — Detroit Metro
- Housing Median Monthly Rent ($), by Zip Code (ZCTA5) — St. Louis Metro
- Housing Median Monthly Rent ($), by Zip Code (ZCTA5) — Chicago Metro
- Housing Median Monthly Rent ($), by Zip Code (ZCTA5) — Dallas Metro
- Housing Median Monthly Rent ($), by Zip Code (ZCTA5) — Denver Metro