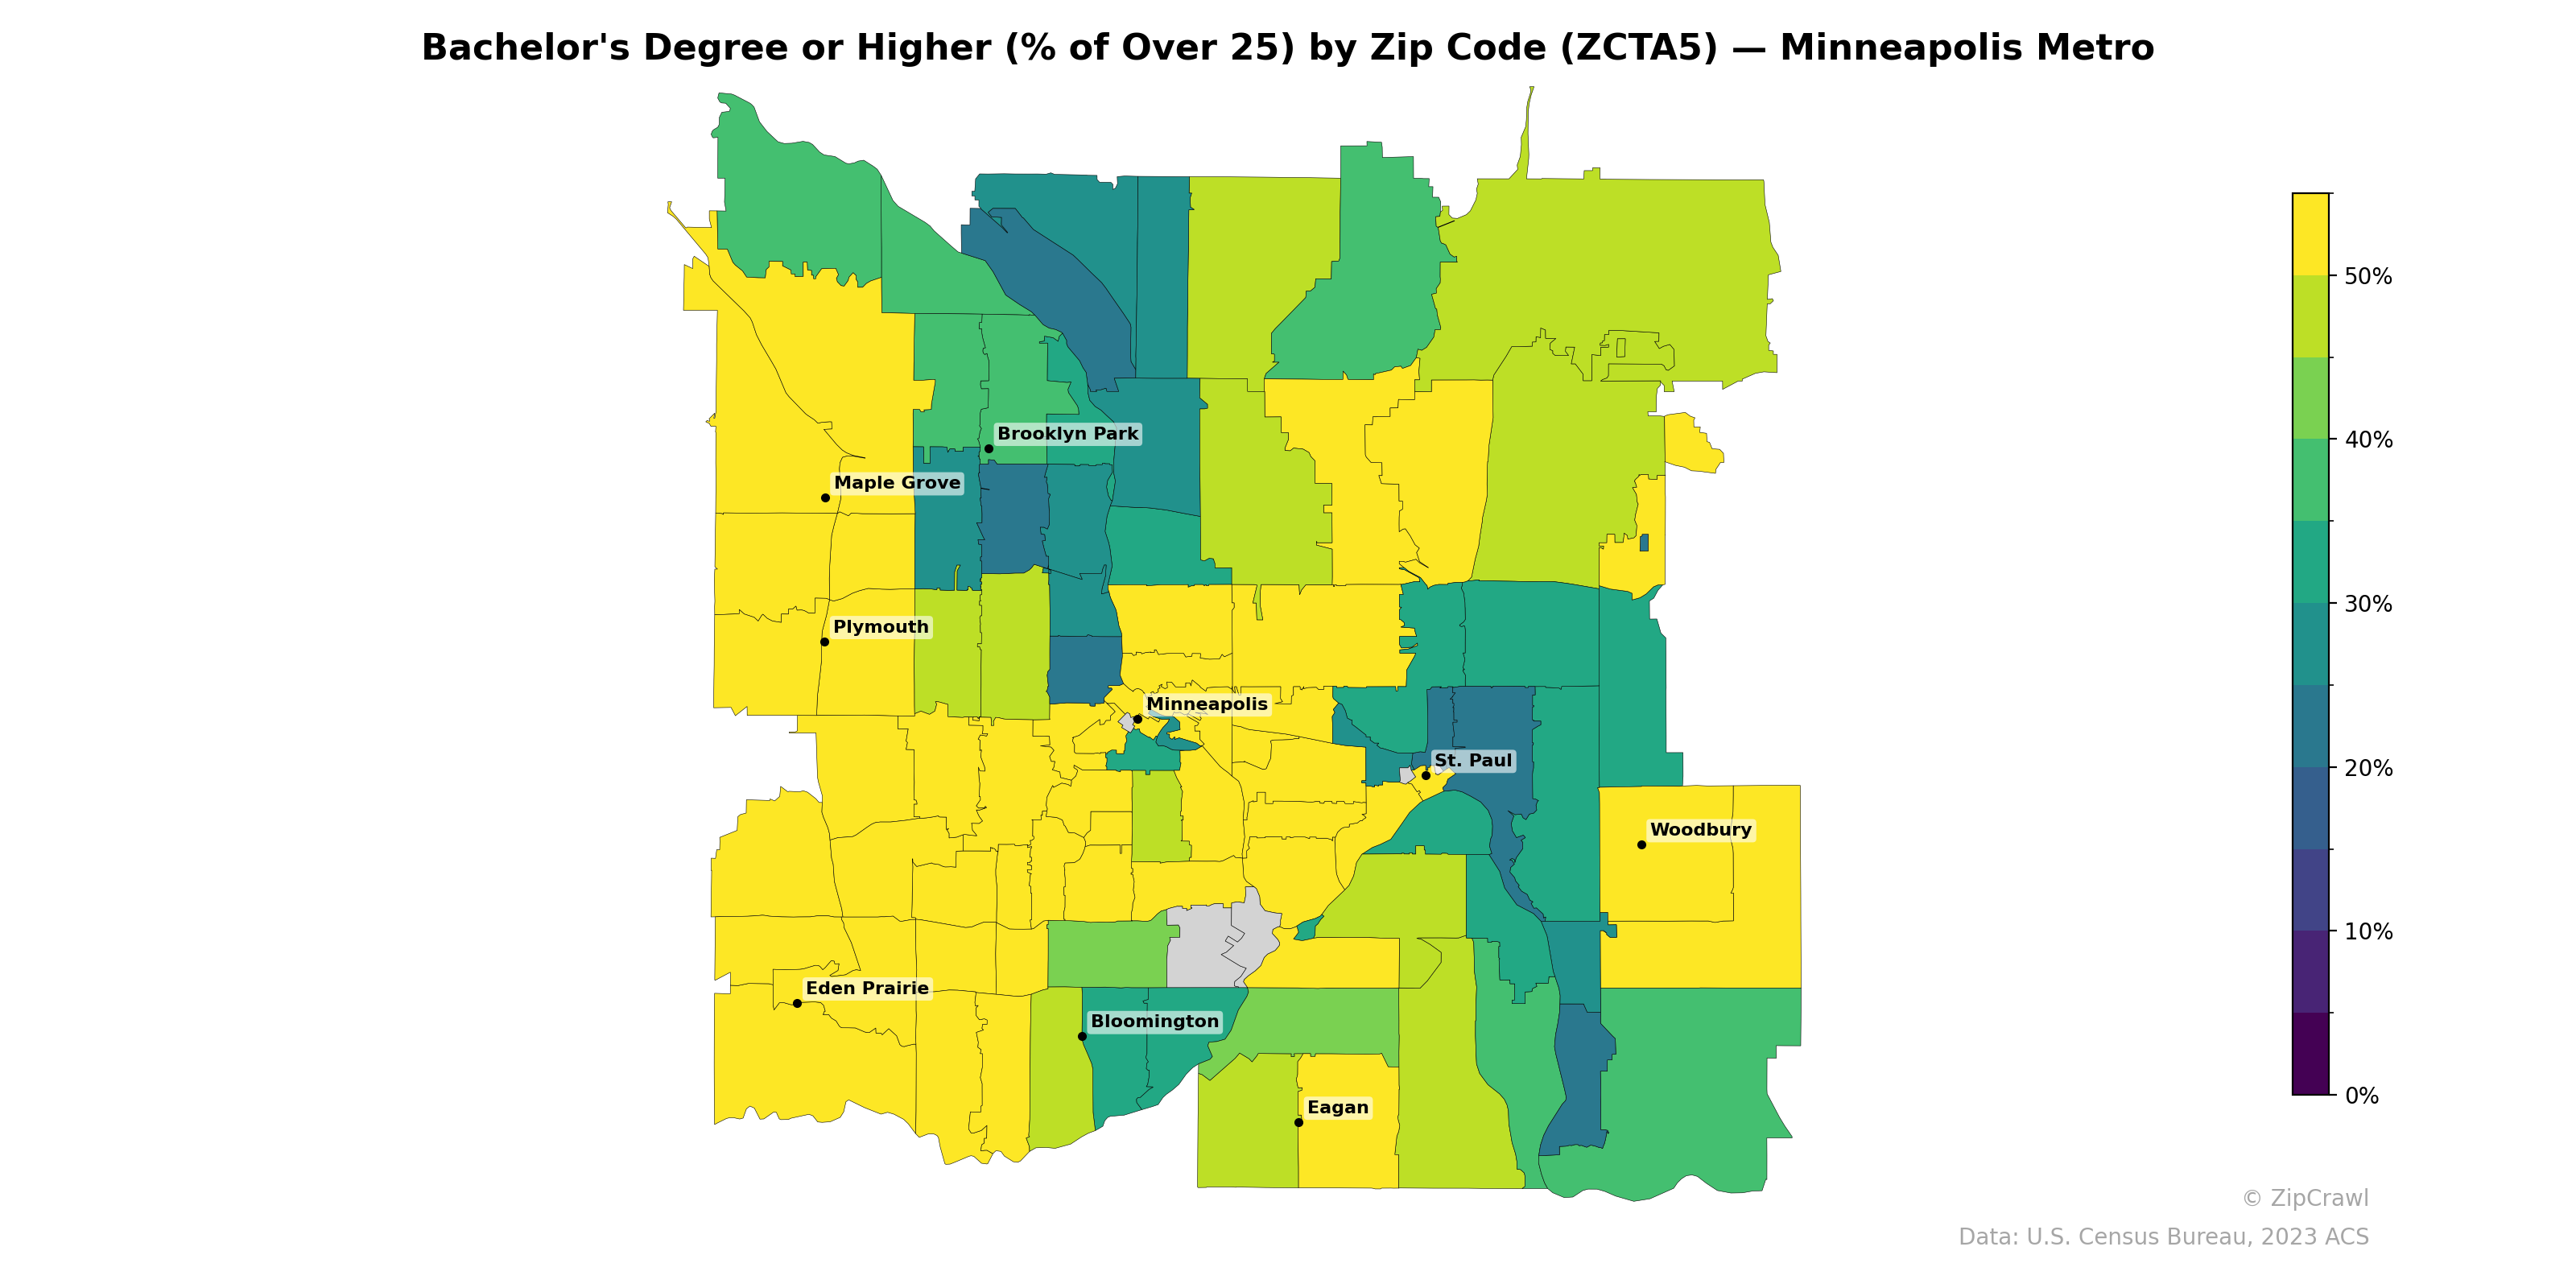
NOTE: Gray indicates insufficient data or a suppressed estimate.
The western and southwestern suburbs—particularly Eden Prairie, Maple Grove, Plymouth, and Woodbury—exhibit the highest concentrations of bachelor's degree attainment, consistently exceeding 50%, while a distinct corridor of lower educational attainment (below 20%) runs through Brooklyn Park and portions of north Minneapolis into the St. Paul urban core. The contrast is especially stark between adjacent zip codes near downtown Minneapolis, where highly educated neighborhoods sit immediately next to areas with some of the metro's lowest rates, suggesting sharp socioeconomic boundaries at the zip code level. Southern suburbs like Eagan and Bloomington display moderate-to-high attainment in the 30–50% range, serving as a transitional zone between the affluent western suburbs and the more mixed eastern portions of the metro.
Data: U.S. Census Bureau, 2023 ACS
Explore
- High School Graduate (% of Over 25) by Zip Code (ZCTA5) — Chicago Metro
- Married Couple (% of all Households) by Zip Code (ZCTA5) — Minneapolis Metro
- % of Households with Broadband Internet, by Zip Code (ZCTA5) — Minneapolis Metro
- % of Population without Health Insurance, by Zip Code (ZCTA5) — Minneapolis Metro
- Household Average Size by Zip Code (ZCTA5) — Minneapolis Metro
- Housing Median Monthly Rent ($), by Zip Code (ZCTA5) — Minneapolis Metro
- Housing Owner-Occupied Median Value ($), by Zip Code (ZCTA5) — Minneapolis Metro
- Housing Owner-Occupied % of Units, by Zip Code (ZCTA5) — Minneapolis Metro
- Housing % of Units Built Since 2010, by Zip Code (ZCTA5) — Minneapolis Metro
- Housing Vacancy Rate by Zip Code (ZCTA5) — Minneapolis Metro
- % of Population without Health Insurance, by County
- Household Median Income by Zip Code (ZCTA5) — Chicago Metro
- U.S. Citizens (% of Population Over 18) by Zip Code (ZCTA5) — Chicago Metro
- Median Age by Zip Code (ZCTA5) — Chicago Metro
- % of Population on Food Stamps or SNAP (Last 12 Months), by Zip Code (ZCTA5) — Los Angeles Metro
- Population Non-Hispanic White % by Zip Code (ZCTA5) — Chicago Metro
- Population Non-Hispanic Black % by Zip Code (ZCTA5) — Chicago Metro
- Population Hispanic % by Zip Code (ZCTA5) — Chicago Metro
- Population Non-Hispanic American Indian % by Zip Code (ZCTA5) — Chicago Metro
- Population Non-Hispanic Asian % by Zip Code (ZCTA5) — Los Angeles Metro
- Housing Owner-Occupied Median Value ($), by Zip Code (ZCTA5) — Boston Metro
- % of Population without Health Insurance, by Zip Code (ZCTA5) — Boston Metro
- Housing Median Monthly Rent ($), by Zip Code (ZCTA5) — Boston Metro
- Population Non-Hispanic White % by Zip Code (ZCTA5) — Boston Metro
- Median Age by Zip Code (ZCTA5) — Boston Metro
- Population Hispanic % by Zip Code (ZCTA5) — Boston Metro
- Population Non-Hispanic American Indian % by Zip Code (ZCTA5) — Boston Metro
- % of Households with Broadband Internet, by Zip Code (ZCTA5) — Boston Metro
- Housing Owner-Occupied % of Units, by Zip Code (ZCTA5) — Boston Metro
- U.S. Citizens (% of Population Over 18) by Zip Code (ZCTA5) — Boston Metro
- Bachelor's Degree or Higher (% of Over 25) by Zip Code (ZCTA5) — Miami Metro
- Bachelor's Degree or Higher (% of Over 25) by Zip Code (ZCTA5) — Denver Metro
- Bachelor's Degree or Higher (% of Over 25) by Zip Code (ZCTA5) — Detroit Metro
- Bachelor's Degree or Higher (% of Over 25) by Zip Code (ZCTA5) — St. Louis Metro
- Bachelor's Degree or Higher (% of Over 25) by Zip Code (ZCTA5) — Orlando Metro
- Bachelor's Degree or Higher (% of Over 25) by Zip Code (ZCTA5) — Boston Metro
- Bachelor's Degree or Higher (% of Over 25) by Zip Code (ZCTA5) — Dallas Metro
- Bachelor's Degree or Higher (% of Over 25) by Zip Code (ZCTA5) — Tampa Metro
- Bachelor's Degree or Higher (% of Over 25) by Zip Code (ZCTA5) — Minnesota
- Bachelor's Degree or Higher (% of Over 25) by Zip Code (ZCTA5) — Houston Metro