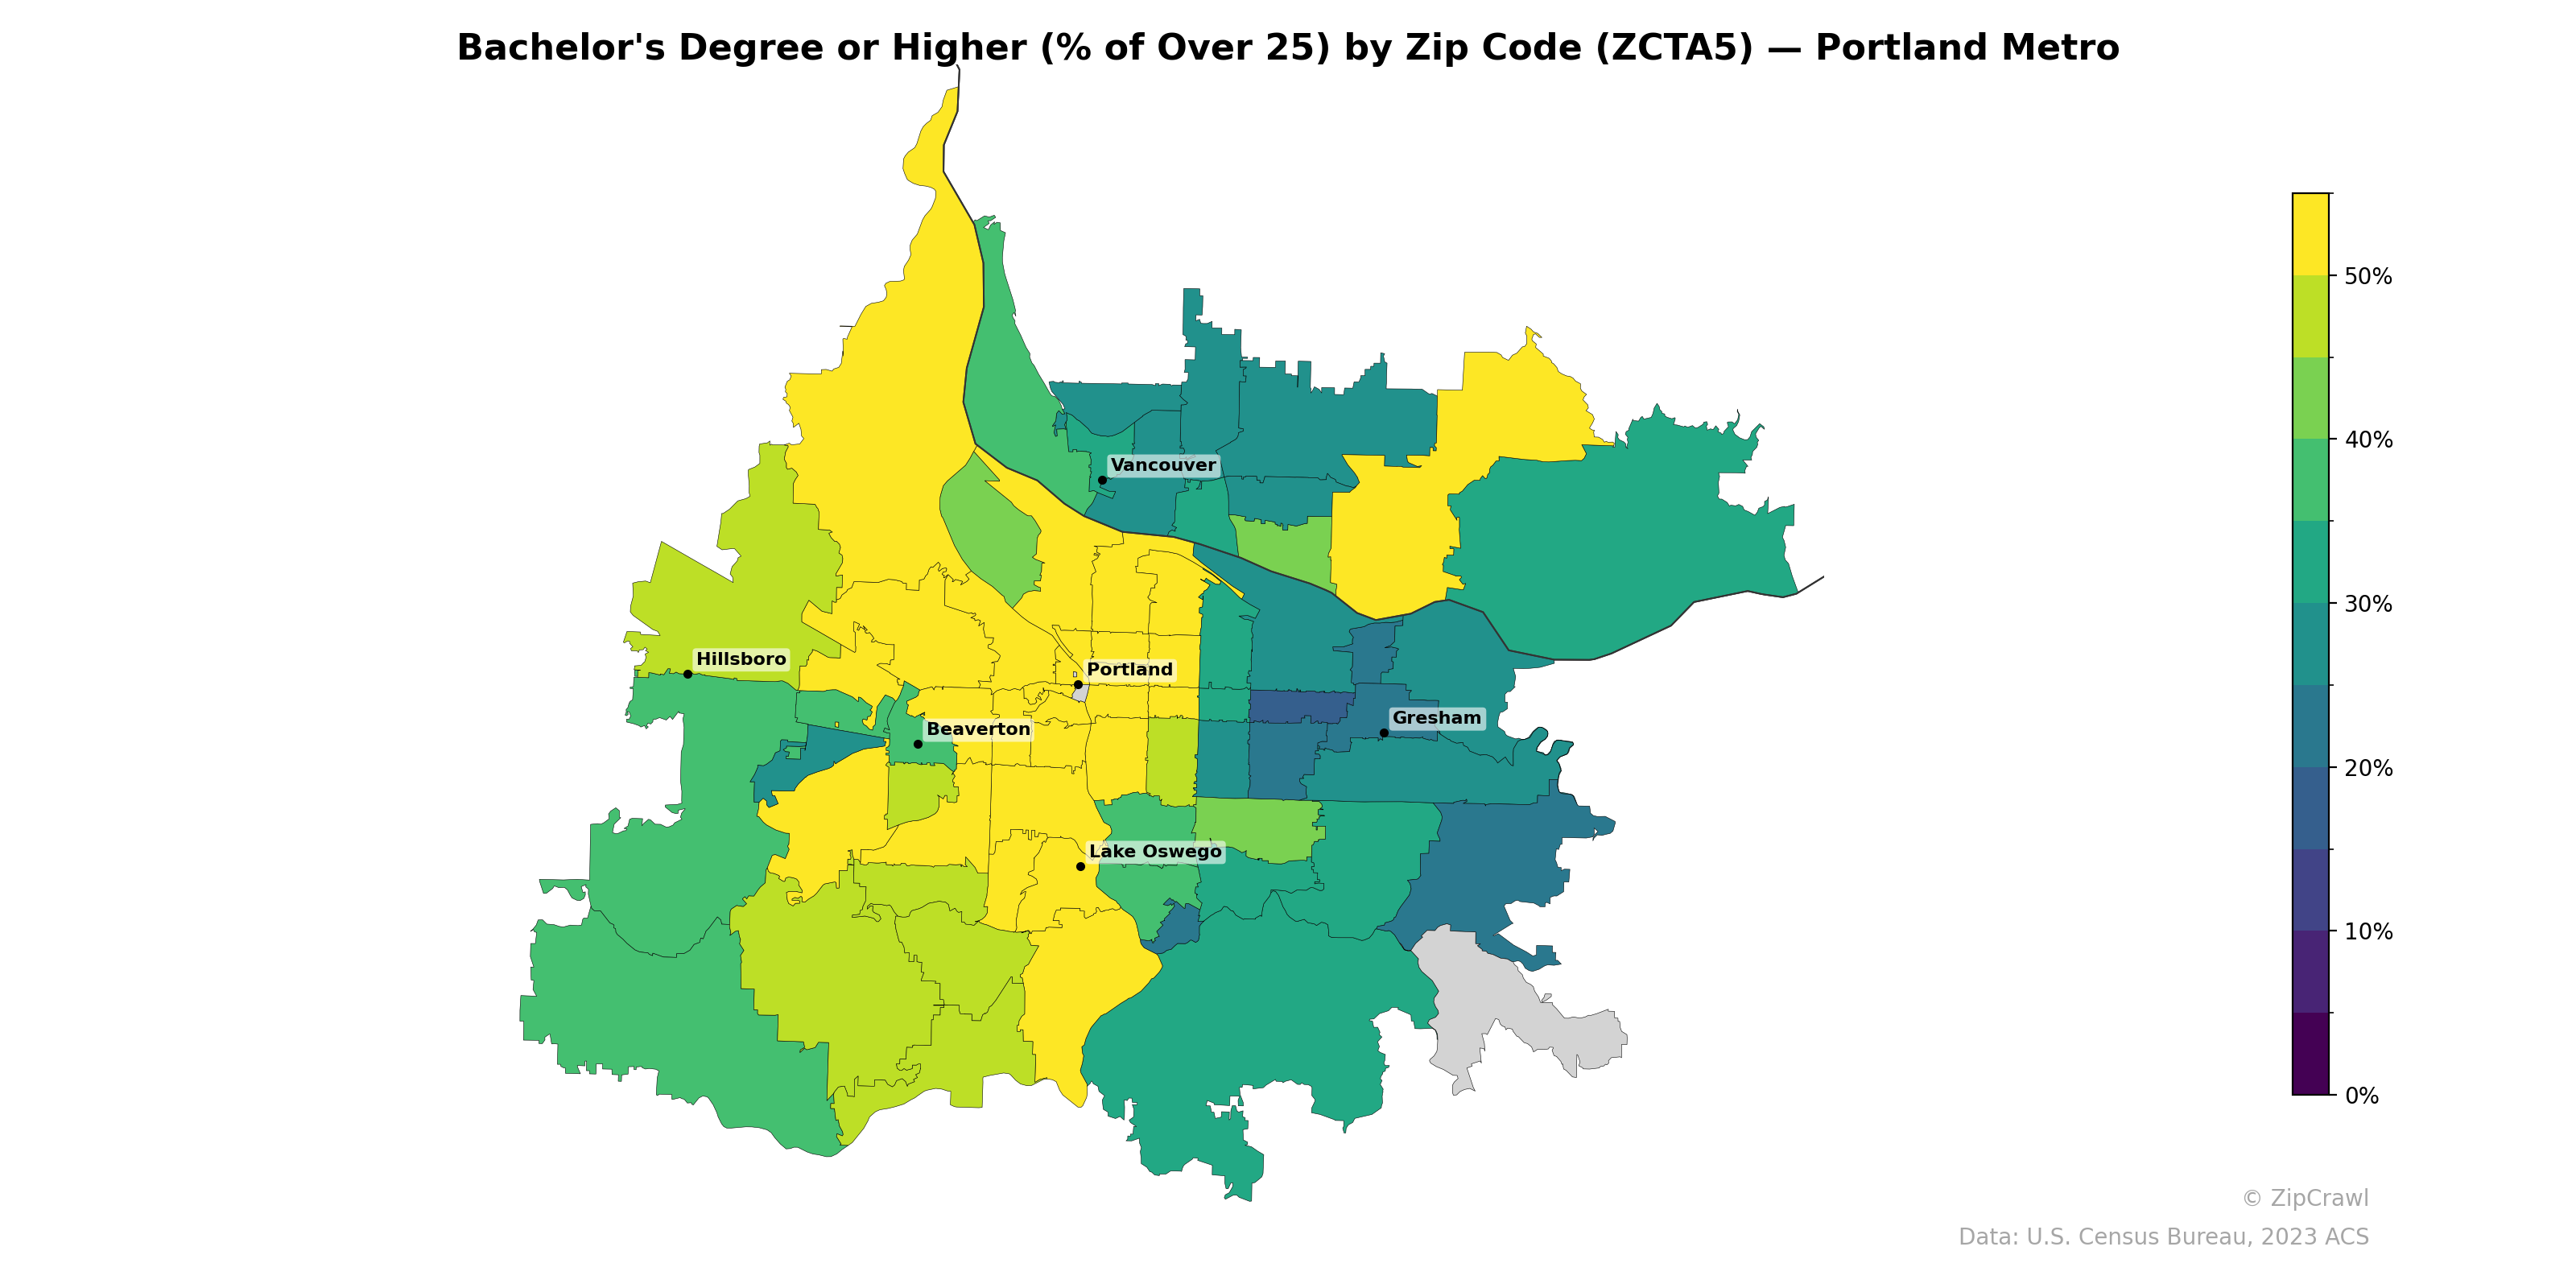
NOTE: Gray indicates insufficient data or a suppressed estimate.
The highest concentrations of bachelor's degree holders cluster in Portland's inner west side, Lake Oswego, and the northwest corridor stretching toward the Columbia River, where rates exceed 50% in several zip codes. A stark educational attainment gradient runs east, with Gresham and outer east Portland zip codes dropping to 10–20%, representing some of the lowest rates in the metro area. Hillsboro and Beaverton display moderate attainment levels around 30–40%, likely reflecting the influence of the tech sector employment base in Washington County.
Data: U.S. Census Bureau, 2023 ACS
Explore
- High School Graduate (% of Over 25) by Zip Code (ZCTA5) — Texas
- Household Average Size by Zip Code (ZCTA5) — Portland Metro
- Housing Owner-Occupied % of Units, by Zip Code (ZCTA5) — Portland Metro
- Housing Owner-Occupied Median Value ($), by Zip Code (ZCTA5) — Portland Metro
- Housing Vacancy Rate by Zip Code (ZCTA5) — Portland Metro
- % of Households with Broadband Internet, by Zip Code (ZCTA5) — Portland Metro
- Housing Median Monthly Rent ($), by Zip Code (ZCTA5) — Portland Metro
- % of Population without Health Insurance, by Zip Code (ZCTA5) — Portland Metro
- Housing % of Units Built Since 2010, by Zip Code (ZCTA5) — Portland Metro
- Married Couple (% of all Households) by Zip Code (ZCTA5) — Portland Metro
- High School Graduate (% of Over 25) by County
- Population Non-Hispanic White % by Zip Code (ZCTA5) — Texas
- U.S. Citizens (% of Population Over 18) by Zip Code (ZCTA5) — Texas
- Household Median Income by Zip Code (ZCTA5) — Texas
- Population Non-Hispanic Asian % by Zip Code (ZCTA5) — Chicago Metro
- Population Non-Hispanic Black % by Zip Code (ZCTA5) — Texas
- Population Hispanic % by Zip Code (ZCTA5) — Texas
- Population Non-Hispanic American Indian % by Zip Code (ZCTA5) — Texas
- Median Age by Zip Code (ZCTA5) — Texas
- % of Population on Food Stamps or SNAP (Last 12 Months), by Zip Code (ZCTA5) — Chicago Metro
- Housing Owner-Occupied % of Units, by Zip Code (ZCTA5) — Baltimore Metro
- % of Households with Broadband Internet, by Zip Code (ZCTA5) — Baltimore Metro
- Housing Owner-Occupied Median Value ($), by Zip Code (ZCTA5) — Baltimore Metro
- % of Population on Food Stamps or SNAP (Last 12 Months), by Zip Code (ZCTA5) — Charlotte Metro
- Population Non-Hispanic Asian % by Zip Code (ZCTA5) — Charlotte Metro
- U.S. Citizens (% of Population Over 18) by Zip Code (ZCTA5) — Baltimore Metro
- High School Graduate (% of Over 25) by Zip Code (ZCTA5) — Baltimore Metro
- Population Non-Hispanic American Indian % by Zip Code (ZCTA5) — Baltimore Metro
- % of Population without Health Insurance, by Zip Code (ZCTA5) — Baltimore Metro
- Population Non-Hispanic Black % by Zip Code (ZCTA5) — Baltimore Metro
- Bachelor's Degree or Higher (% of Over 25) by Zip Code (ZCTA5) — Orlando Metro
- Bachelor's Degree or Higher (% of Over 25) by Zip Code (ZCTA5) — Denver Metro
- Bachelor's Degree or Higher (% of Over 25) by Zip Code (ZCTA5) — Atlanta Metro
- Bachelor's Degree or Higher (% of Over 25) by Zip Code (ZCTA5) — Detroit Metro
- Bachelor's Degree or Higher (% of Over 25) by Zip Code (ZCTA5) — Miami Metro
- Bachelor's Degree or Higher (% of Over 25) by Zip Code (ZCTA5) — Phoenix Metro
- Bachelor's Degree or Higher (% of Over 25) by Zip Code (ZCTA5) — Dallas Metro
- Bachelor's Degree or Higher (% of Over 25) by Zip Code (ZCTA5) — Boston Metro
- Bachelor's Degree or Higher (% of Over 25) by Zip Code (ZCTA5) — Tampa Metro
- Bachelor's Degree or Higher (% of Over 25) by Zip Code (ZCTA5) — Houston Metro