NOTE: Gray indicates insufficient data or a suppressed estimate.
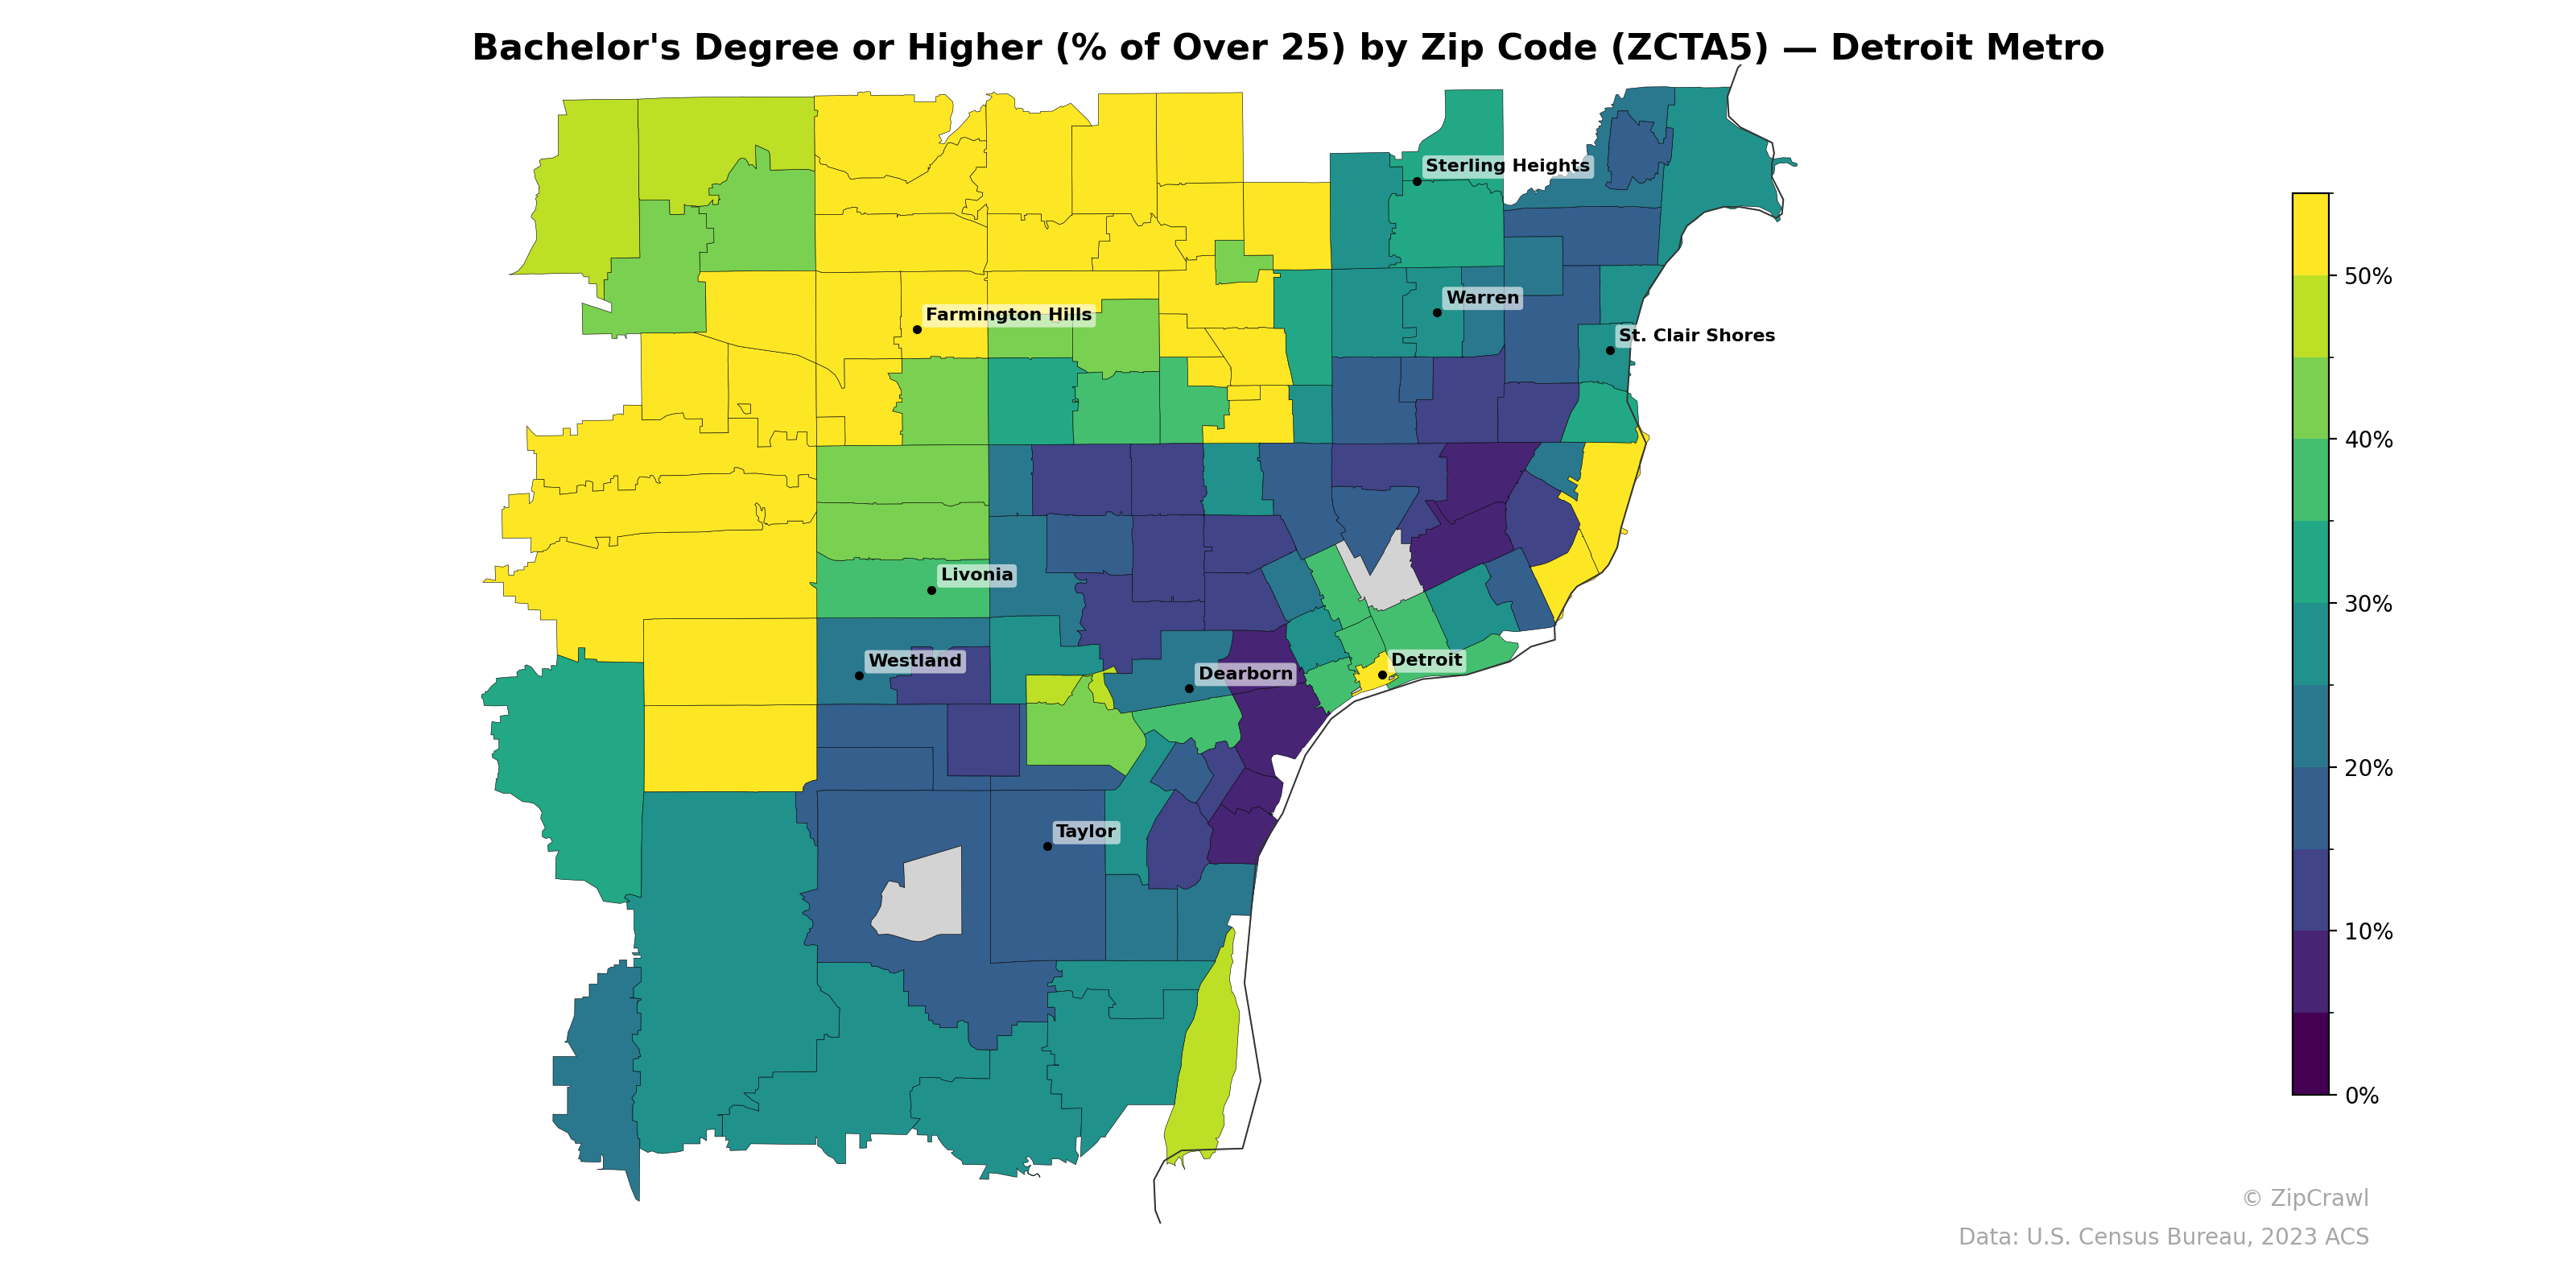
The northwest suburbs, particularly around Farmington Hills and extending into Oakland County, exhibit the highest concentrations of bachelor's degree attainment, with many zip codes exceeding 50%, while central Detroit and its immediately surrounding zip codes fall sharply to under 15%. A notable education gradient radiates outward from Detroit's core, with Macomb County communities like Sterling Heights and St. Clair Shores occupying a middle band of roughly 25–35%, and the southern downriver communities near Taylor showing more mixed attainment levels that generally trail the affluent northwestern suburbs.
Data: U.S. Census Bureau, 2023 ACS
Explore
- Population Non-Hispanic White % by Zip Code (ZCTA5) — Chicago Metro
- Household Average Size by Zip Code (ZCTA5) — Detroit Metro
- Housing Owner-Occupied % of Units, by Zip Code (ZCTA5) — Detroit Metro
- % of Population without Health Insurance, by Zip Code (ZCTA5) — Detroit Metro
- Married Couple (% of all Households) by Zip Code (ZCTA5) — Detroit Metro
- Housing Median Monthly Rent ($), by Zip Code (ZCTA5) — Detroit Metro
- Housing % of Units Built Since 2010, by Zip Code (ZCTA5) — Detroit Metro
- Housing Owner-Occupied Median Value ($), by Zip Code (ZCTA5) — Detroit Metro
- Housing Vacancy Rate by Zip Code (ZCTA5) — Detroit Metro
- % of Households with Broadband Internet, by Zip Code (ZCTA5) — Detroit Metro
- Married Couple (% of all Households) by Zip Code (ZCTA5) — Washington D.C.
- % of Population without Health Insurance, by County
- Household Median Income by Zip Code (ZCTA5) — Chicago Metro
- Median Age by Zip Code (ZCTA5) — Chicago Metro
- Population Non-Hispanic Asian % by Zip Code (ZCTA5) — Los Angeles Metro
- % of Population on Food Stamps or SNAP (Last 12 Months), by Zip Code (ZCTA5) — Los Angeles Metro
- Population Non-Hispanic Black % by Zip Code (ZCTA5) — Chicago Metro
- Population Hispanic % by Zip Code (ZCTA5) — Chicago Metro
- Population Non-Hispanic American Indian % by Zip Code (ZCTA5) — Chicago Metro
- High School Graduate (% of Over 25) by Zip Code (ZCTA5) — Chicago Metro
- U.S. Citizens (% of Population Over 18) by Zip Code (ZCTA5) — Chicago Metro
- Housing Owner-Occupied Median Value ($), by Zip Code (ZCTA5) — Boston Metro
- % of Population without Health Insurance, by Zip Code (ZCTA5) — Boston Metro
- Housing Median Monthly Rent ($), by Zip Code (ZCTA5) — Boston Metro
- Population Non-Hispanic White % by Zip Code (ZCTA5) — Boston Metro
- Median Age by Zip Code (ZCTA5) — Boston Metro
- Population Non-Hispanic American Indian % by Zip Code (ZCTA5) — Boston Metro
- % of Households with Broadband Internet, by Zip Code (ZCTA5) — Boston Metro
- Housing Owner-Occupied % of Units, by Zip Code (ZCTA5) — Boston Metro
- Population Hispanic % by Zip Code (ZCTA5) — Boston Metro
- Bachelor's Degree or Higher (% of Over 25) by Zip Code (ZCTA5) — Denver Metro
- Bachelor's Degree or Higher (% of Over 25) by Zip Code (ZCTA5) — Miami Metro
- Bachelor's Degree or Higher (% of Over 25) by Zip Code (ZCTA5) — Orlando Metro
- Bachelor's Degree or Higher (% of Over 25) by Zip Code (ZCTA5) — Boston Metro
- Bachelor's Degree or Higher (% of Over 25) by Zip Code (ZCTA5) — Tampa Metro
- Bachelor's Degree or Higher (% of Over 25) by Zip Code (ZCTA5) — Dallas Metro
- Bachelor's Degree or Higher (% of Over 25) by Zip Code (ZCTA5) — Seattle Metro
- Bachelor's Degree or Higher (% of Over 25) by Zip Code (ZCTA5) — Houston Metro
- Bachelor's Degree or Higher (% of Over 25) by Zip Code (ZCTA5) — Chicago Metro
- Bachelor's Degree or Higher (% of Over 25) by Zip Code (ZCTA5) — Austin Metro