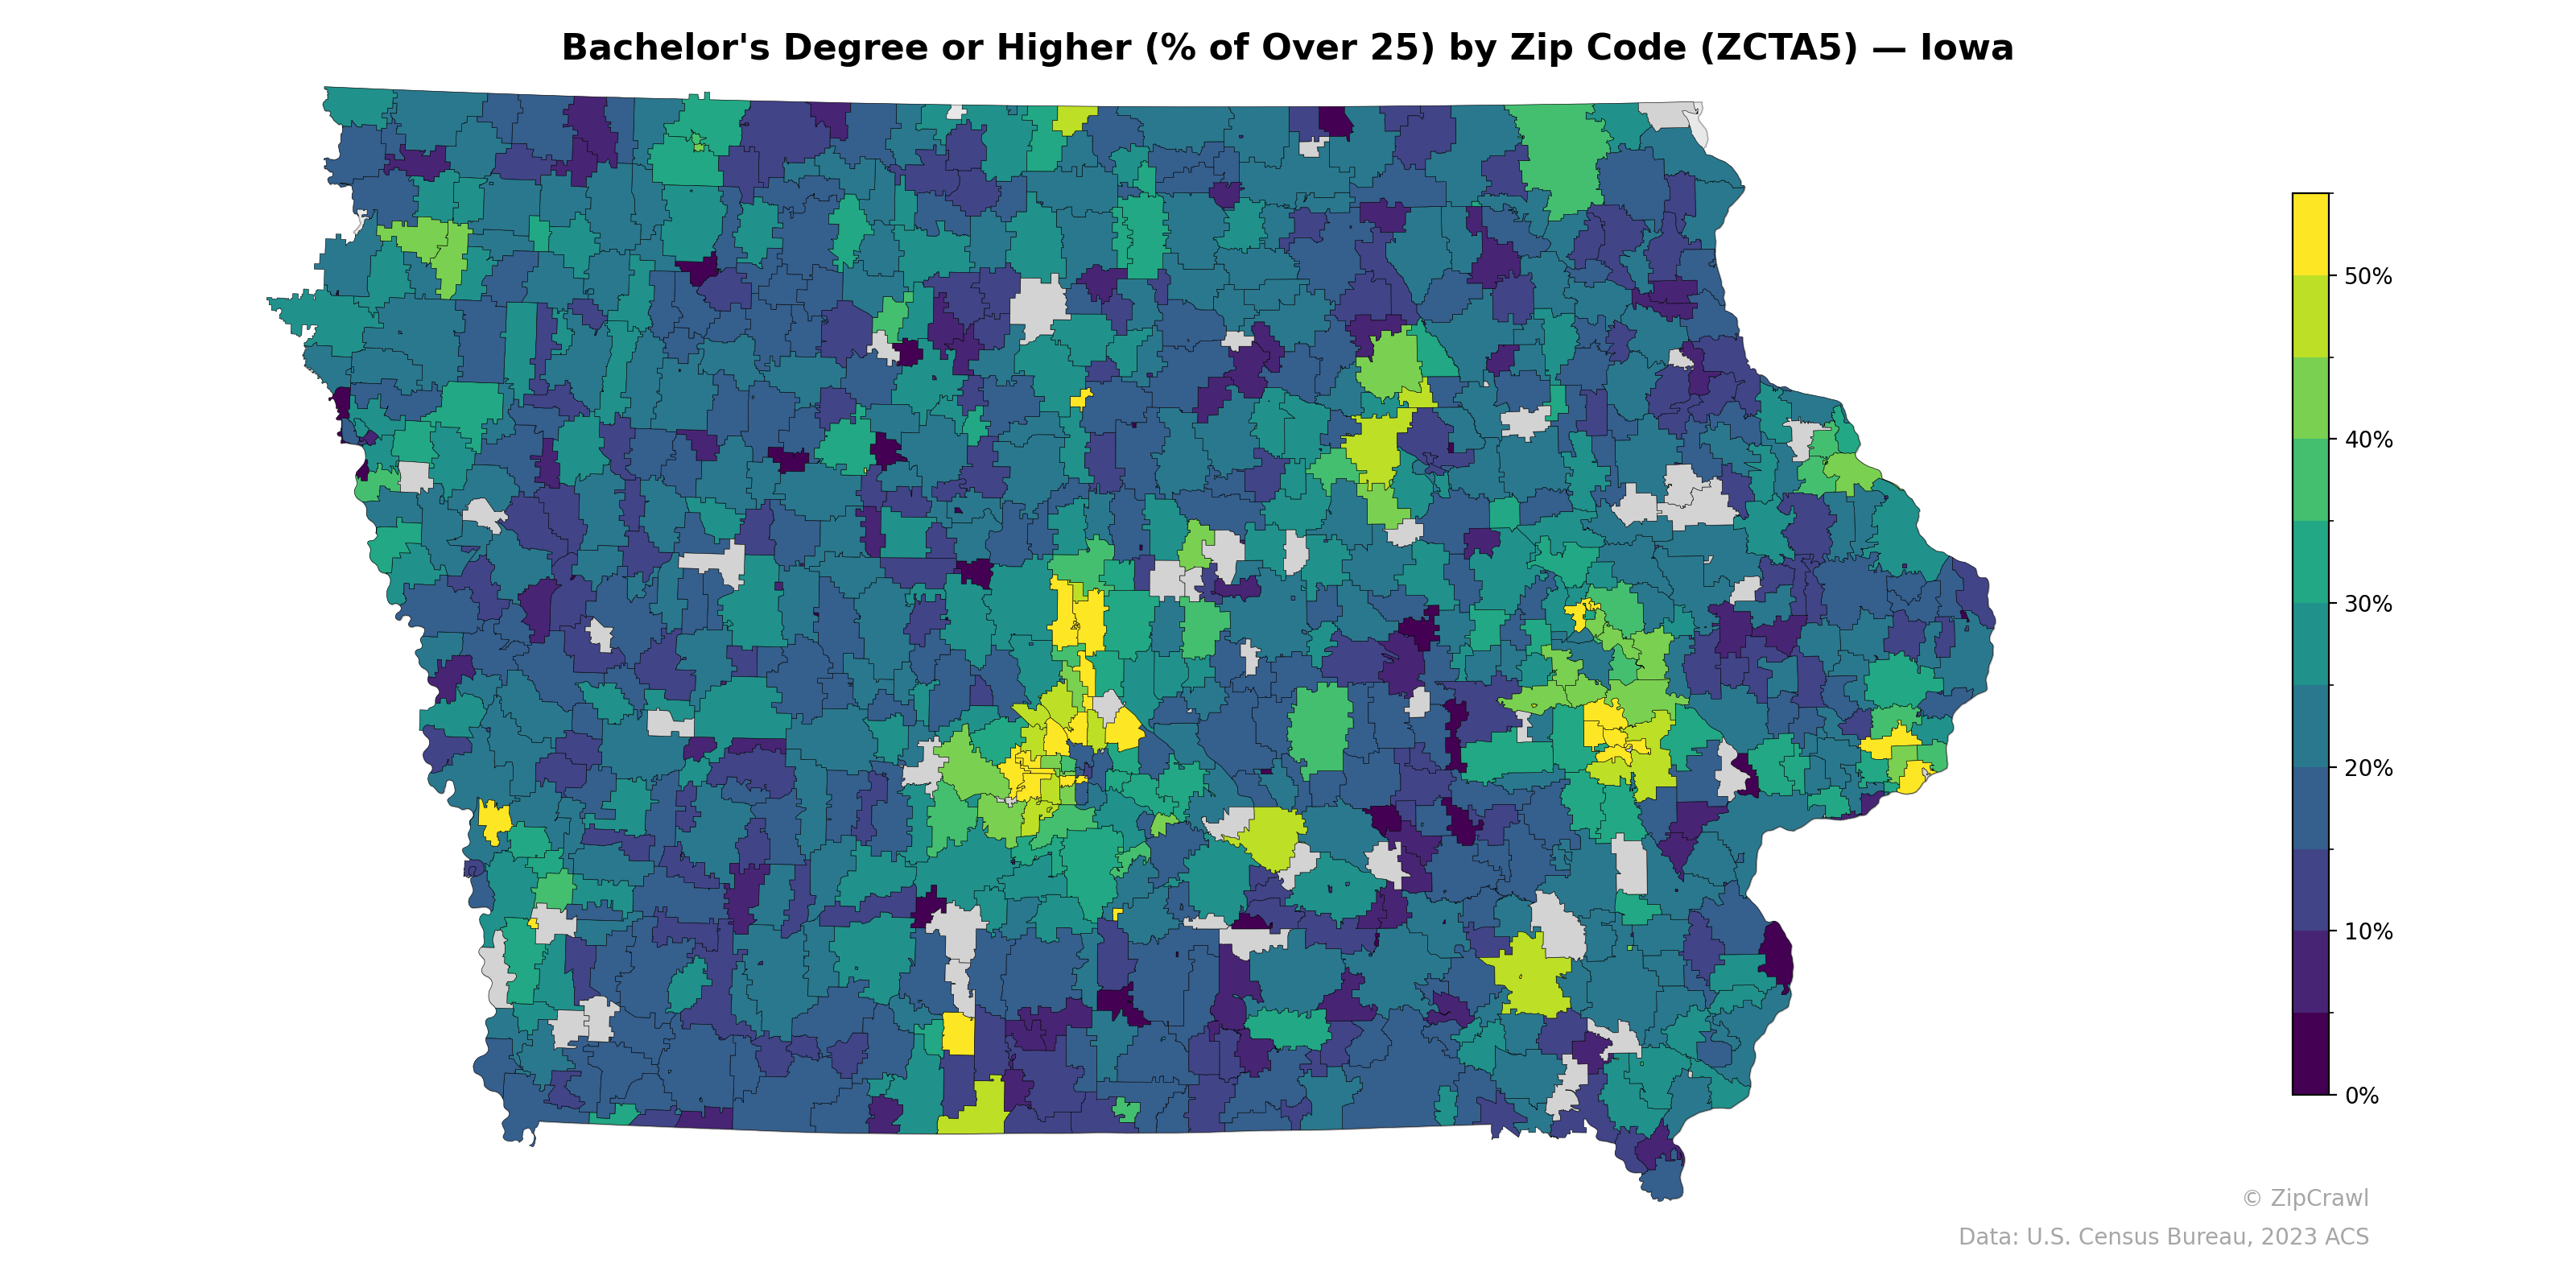
NOTE: Gray indicates insufficient data or a suppressed estimate.
Higher concentrations of bachelor's degree attainment cluster around Iowa's major metropolitan areas, with Des Moines (central), Iowa City/Cedar Rapids (east-central), and Ames (central) displaying zip codes exceeding 40-50%, likely driven by the presence of major universities and white-collar employment centers. Rural zip codes across northern and western Iowa consistently fall below 15-20%, creating a stark urban-rural educational divide that is among the most pronounced spatial patterns in the state. Notable secondary clusters of moderate attainment (25-35%) appear around smaller college towns and regional centers such as Cedar Falls/Waterloo, Dubuque, and the Quad Cities area along the eastern border.
Data: U.S. Census Bureau, 2023 ACS
Explore
- Median Age by Zip Code (ZCTA5) — Florida
- % of Population without Health Insurance, by Zip Code (ZCTA5) — Iowa
- Population Non-Hispanic American Indian % by Zip Code (ZCTA5) — Iowa
- High School Graduate (% of Over 25) by Zip Code (ZCTA5) — Iowa
- Household Average Size by Zip Code (ZCTA5) — Iowa
- Housing % of Units Built Since 2010, by Zip Code (ZCTA5) — Iowa
- Housing Median Monthly Rent ($), by Zip Code (ZCTA5) — Iowa
- % of Households with Broadband Internet, by Zip Code (ZCTA5) — Iowa
- Housing Owner-Occupied Median Value ($), by Zip Code (ZCTA5) — Iowa
- Housing Owner-Occupied % of Units, by Zip Code (ZCTA5) — Iowa
- Housing Owner-Occupied Median Value ($), by County
- High School Graduate (% of Over 25) by Zip Code (ZCTA5) — Florida
- Population Non-Hispanic Black % by Zip Code (ZCTA5) — Florida
- U.S. Citizens (% of Population Over 18) by Zip Code (ZCTA5) — New York
- Population Non-Hispanic American Indian % by Zip Code (ZCTA5) — Florida
- U.S. Citizens (% of Population Over 18) by Zip Code (ZCTA5) — Dallas Metro
- Household Median Income by Zip Code (ZCTA5) — Florida
- Population Non-Hispanic White % by Zip Code (ZCTA5) — Florida
- U.S. Citizens (% of Population Over 18) by Zip Code (ZCTA5) — Florida
- Population Non-Hispanic Asian % by Zip Code (ZCTA5) — California
- % of Population on Food Stamps or SNAP (Last 12 Months), by Zip Code (ZCTA5) — California
- Population Hispanic % by Zip Code (ZCTA5) — Florida
- Household Average Size by Zip Code (ZCTA5) — Connecticut
- Median Age by Zip Code (ZCTA5) — Iowa
- Married Couple (% of all Households) by Zip Code (ZCTA5) — Connecticut
- Population Non-Hispanic American Indian % by Zip Code (ZCTA5) — Connecticut
- Household Median Income by Zip Code (ZCTA5) — Iowa
- Housing Median Monthly Rent ($), by Zip Code (ZCTA5) — Nevada
- Population Hispanic % by Zip Code (ZCTA5) — Mississippi
- Housing % of Units Built Since 2010, by Zip Code (ZCTA5) — Connecticut
- Bachelor's Degree or Higher (% of Over 25) by Zip Code (ZCTA5) — Idaho
- Bachelor's Degree or Higher (% of Over 25) by Zip Code (ZCTA5) — Ohio
- Bachelor's Degree or Higher (% of Over 25) by Zip Code (ZCTA5) — Utah
- Bachelor's Degree or Higher (% of Over 25) by Zip Code (ZCTA5) — Oregon
- Bachelor's Degree or Higher (% of Over 25) by Zip Code (ZCTA5) — Indiana
- Bachelor's Degree or Higher (% of Over 25) by Zip Code (ZCTA5) — Hawaii
- Bachelor's Degree or Higher (% of Over 25) by Zip Code (ZCTA5) — Maine
- Bachelor's Degree or Higher (% of Over 25) by Zip Code (ZCTA5) — Colorado
- Bachelor's Degree or Higher (% of Over 25) by Zip Code (ZCTA5) — Texas
- Bachelor's Degree or Higher (% of Over 25) by Zip Code (ZCTA5) — Illinois