NOTE: Gray indicates insufficient data or a suppressed estimate.
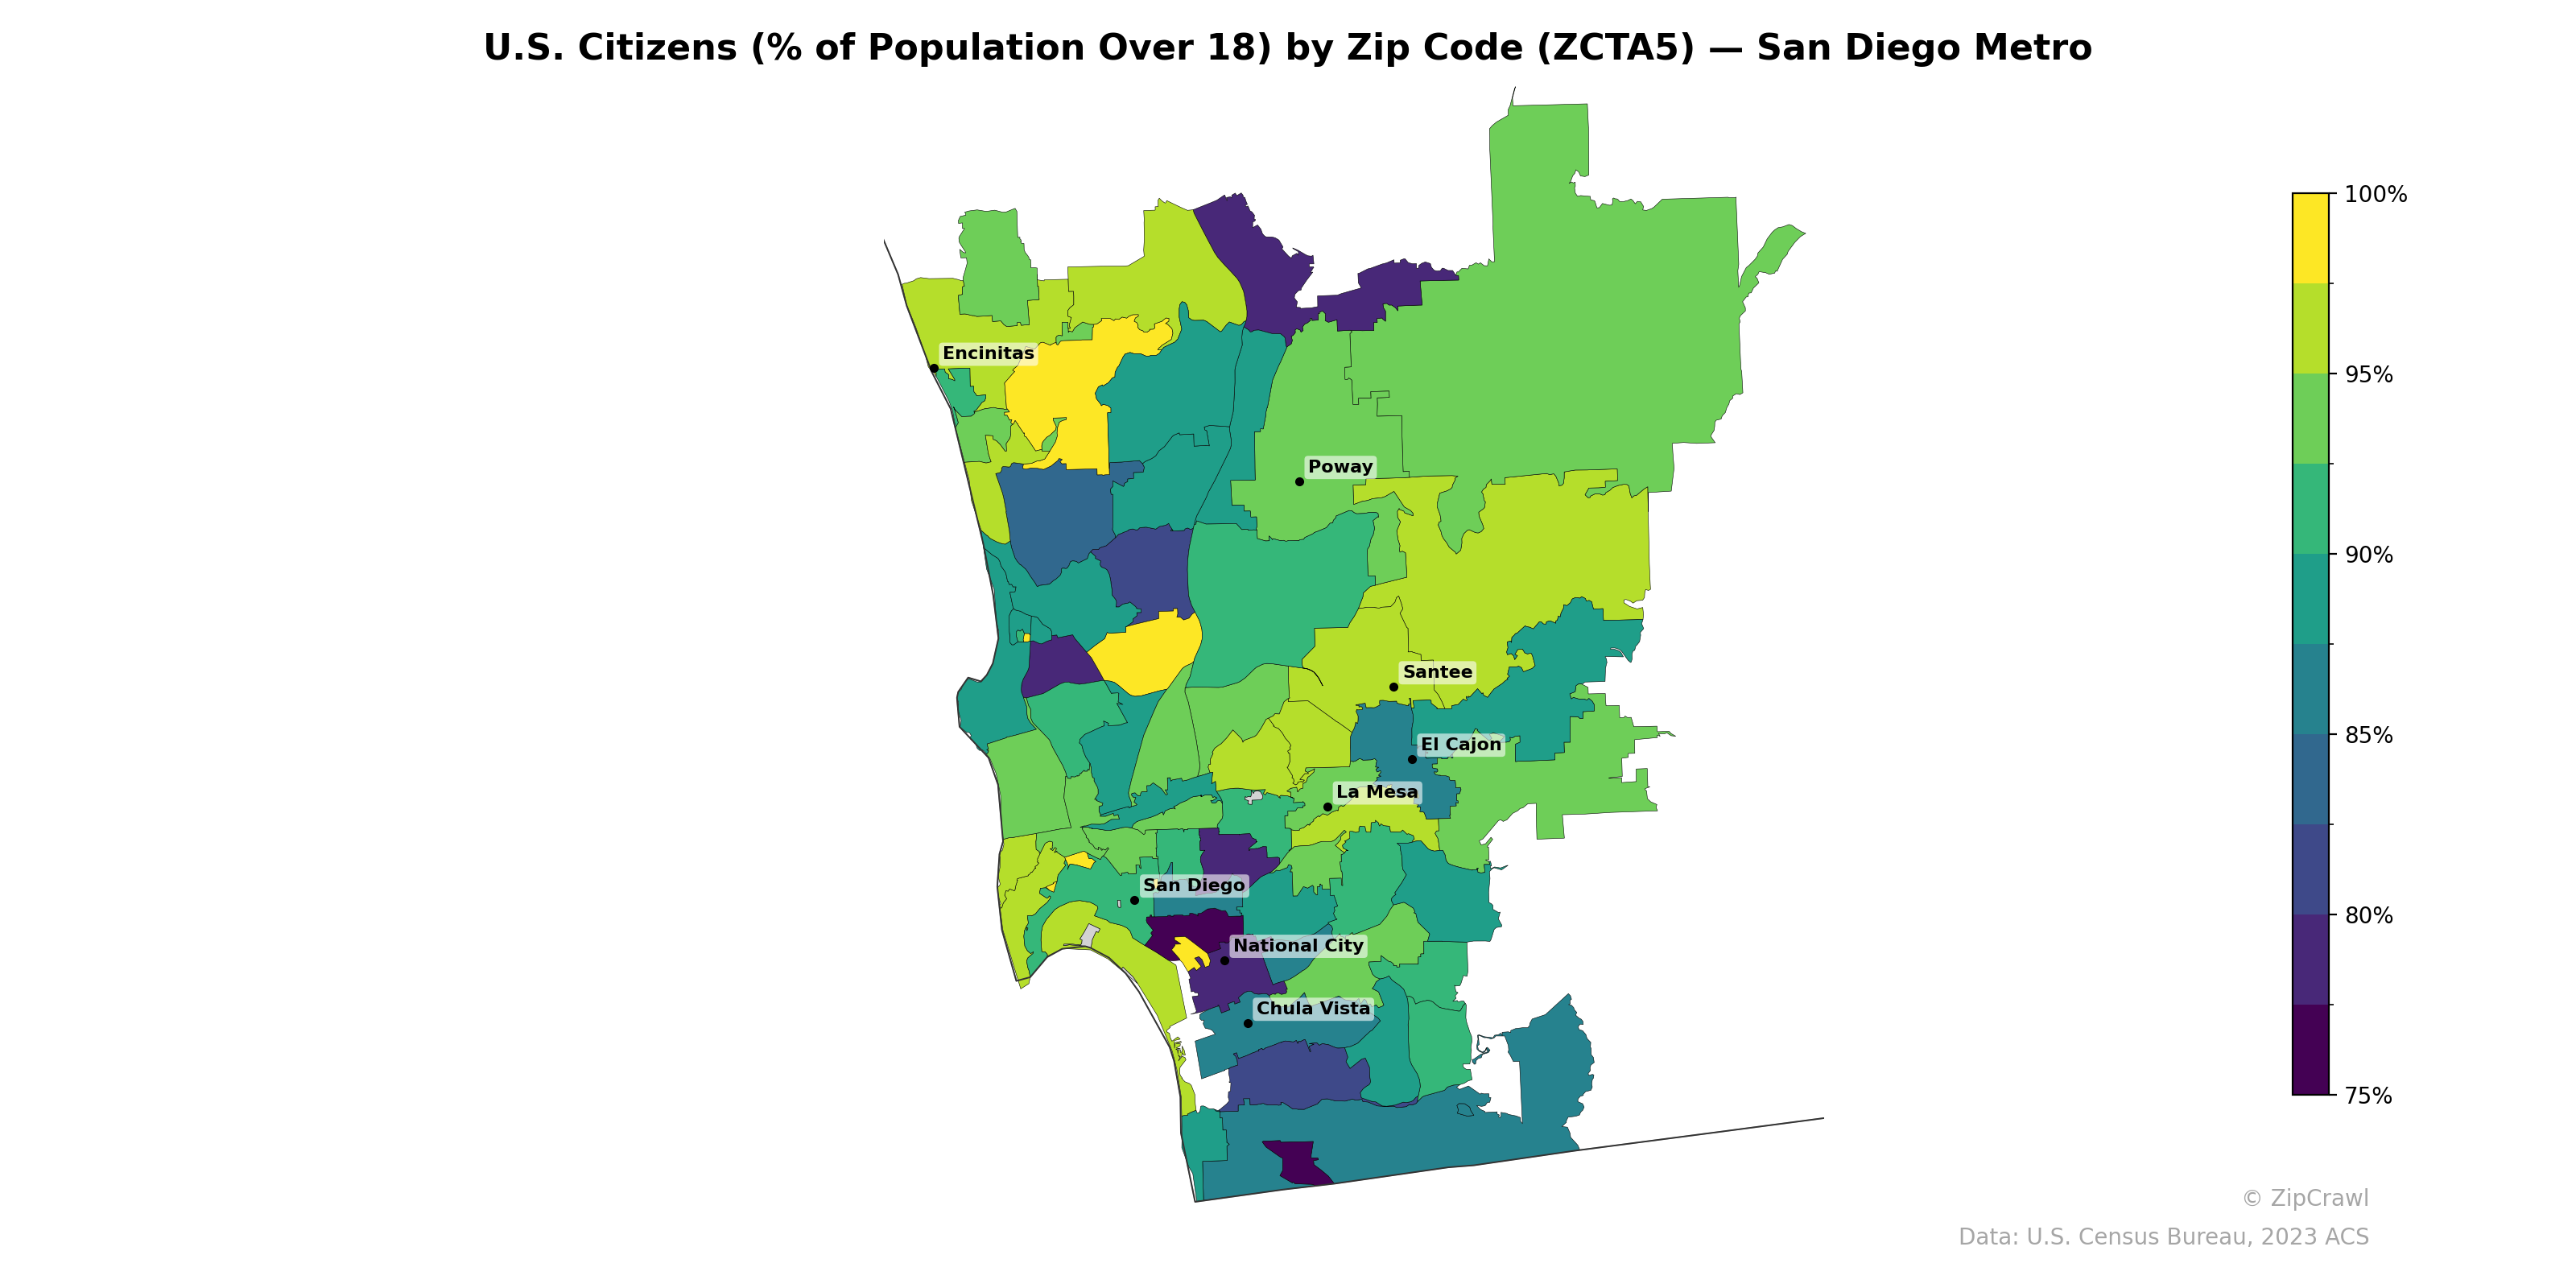
Zip codes in the eastern inland portions of the metro, particularly around Poway, Santee, and the large rural zones to the northeast, consistently exhibit U.S. citizenship rates above 95% among the adult population, while the lowest rates—falling below 80%—cluster in a corridor stretching from National City through parts of Chula Vista and into southern San Diego near the border. Coastal zip codes between Encinitas and central San Diego display moderate variation, with several pockets in the mid-80s to low-90s range, suggesting concentrations of non-citizen residents in urbanized coastal neighborhoods alongside higher-citizenship suburban areas. The sharpest contrasts occur within just a few miles of downtown San Diego, where adjacent zip codes can differ by 15–20 percentage points, reflecting the metro's highly localized patterns of immigrant settlement.
Data: U.S. Census Bureau, 2023 ACS
Explore
- % of Population without Health Insurance, by Zip Code (ZCTA5) — Chicago Metro
- Population Non-Hispanic Black % by Zip Code (ZCTA5) — San Diego Metro
- % of Population on Food Stamps or SNAP (Last 12 Months), by Zip Code (ZCTA5) — Tampa Metro
- Population Hispanic % by Zip Code (ZCTA5) — San Diego Metro
- High School Graduate (% of Over 25) by Zip Code (ZCTA5) — San Diego Metro
- Population Non-Hispanic White % by Zip Code (ZCTA5) — San Diego Metro
- Median Age by Zip Code (ZCTA5) — San Diego Metro
- Household Median Income by Zip Code (ZCTA5) — San Diego Metro
- Population Non-Hispanic American Indian % by Zip Code (ZCTA5) — San Diego Metro
- Population Non-Hispanic Asian % by Zip Code (ZCTA5) — Tampa Metro
- Population Non-Hispanic American Indian % by County
- Married Couple (% of all Households) by Zip Code (ZCTA5) — Chicago Metro
- Housing Vacancy Rate by Zip Code (ZCTA5) — Chicago Metro
- Housing Owner-Occupied % of Units, by Zip Code (ZCTA5) — Chicago Metro
- Housing Median Monthly Rent ($), by Zip Code (ZCTA5) — Chicago Metro
- Bachelor's Degree or Higher (% of Over 25) by Zip Code (ZCTA5) — Chicago Metro
- Housing % of Units Built Since 2010, by Zip Code (ZCTA5) — Chicago Metro
- % of Households with Broadband Internet, by Zip Code (ZCTA5) — Chicago Metro
- Household Median Income by Zip Code (ZCTA5) — New York Metro
- Housing Owner-Occupied Median Value ($), by Zip Code (ZCTA5) — Chicago Metro
- Household Average Size by Zip Code (ZCTA5) — Chicago Metro
- Housing Owner-Occupied % of Units, by Zip Code (ZCTA5) — Denver Metro
- % of Households with Broadband Internet, by Zip Code (ZCTA5) — Denver Metro
- Housing Owner-Occupied Median Value ($), by Zip Code (ZCTA5) — Denver Metro
- Population Non-Hispanic Black % by Zip Code (ZCTA5) — Denver Metro
- Population Hispanic % by Zip Code (ZCTA5) — Denver Metro
- Population Non-Hispanic American Indian % by Zip Code (ZCTA5) — Denver Metro
- Bachelor's Degree or Higher (% of Over 25) by Zip Code (ZCTA5) — Denver Metro
- % of Population without Health Insurance, by Zip Code (ZCTA5) — Denver Metro
- Median Age by Zip Code (ZCTA5) — Denver Metro
- U.S. Citizens (% of Population Over 18) by Zip Code (ZCTA5) — Denver Metro
- U.S. Citizens (% of Population Over 18) by Zip Code (ZCTA5) — Detroit Metro
- U.S. Citizens (% of Population Over 18) by Zip Code (ZCTA5) — San Antonio Metro
- U.S. Citizens (% of Population Over 18) by Zip Code (ZCTA5) — Dallas Metro
- U.S. Citizens (% of Population Over 18) by Zip Code (ZCTA5) — Chicago Metro
- U.S. Citizens (% of Population Over 18) by Zip Code (ZCTA5) — Boston Metro
- U.S. Citizens (% of Population Over 18) by Zip Code (ZCTA5) — Miami Metro
- U.S. Citizens (% of Population Over 18) by Zip Code (ZCTA5) — Tampa Metro
- U.S. Citizens (% of Population Over 18) by Zip Code (ZCTA5) — San Francisco Metro
- U.S. Citizens (% of Population Over 18) by Zip Code (ZCTA5) — Houston Metro