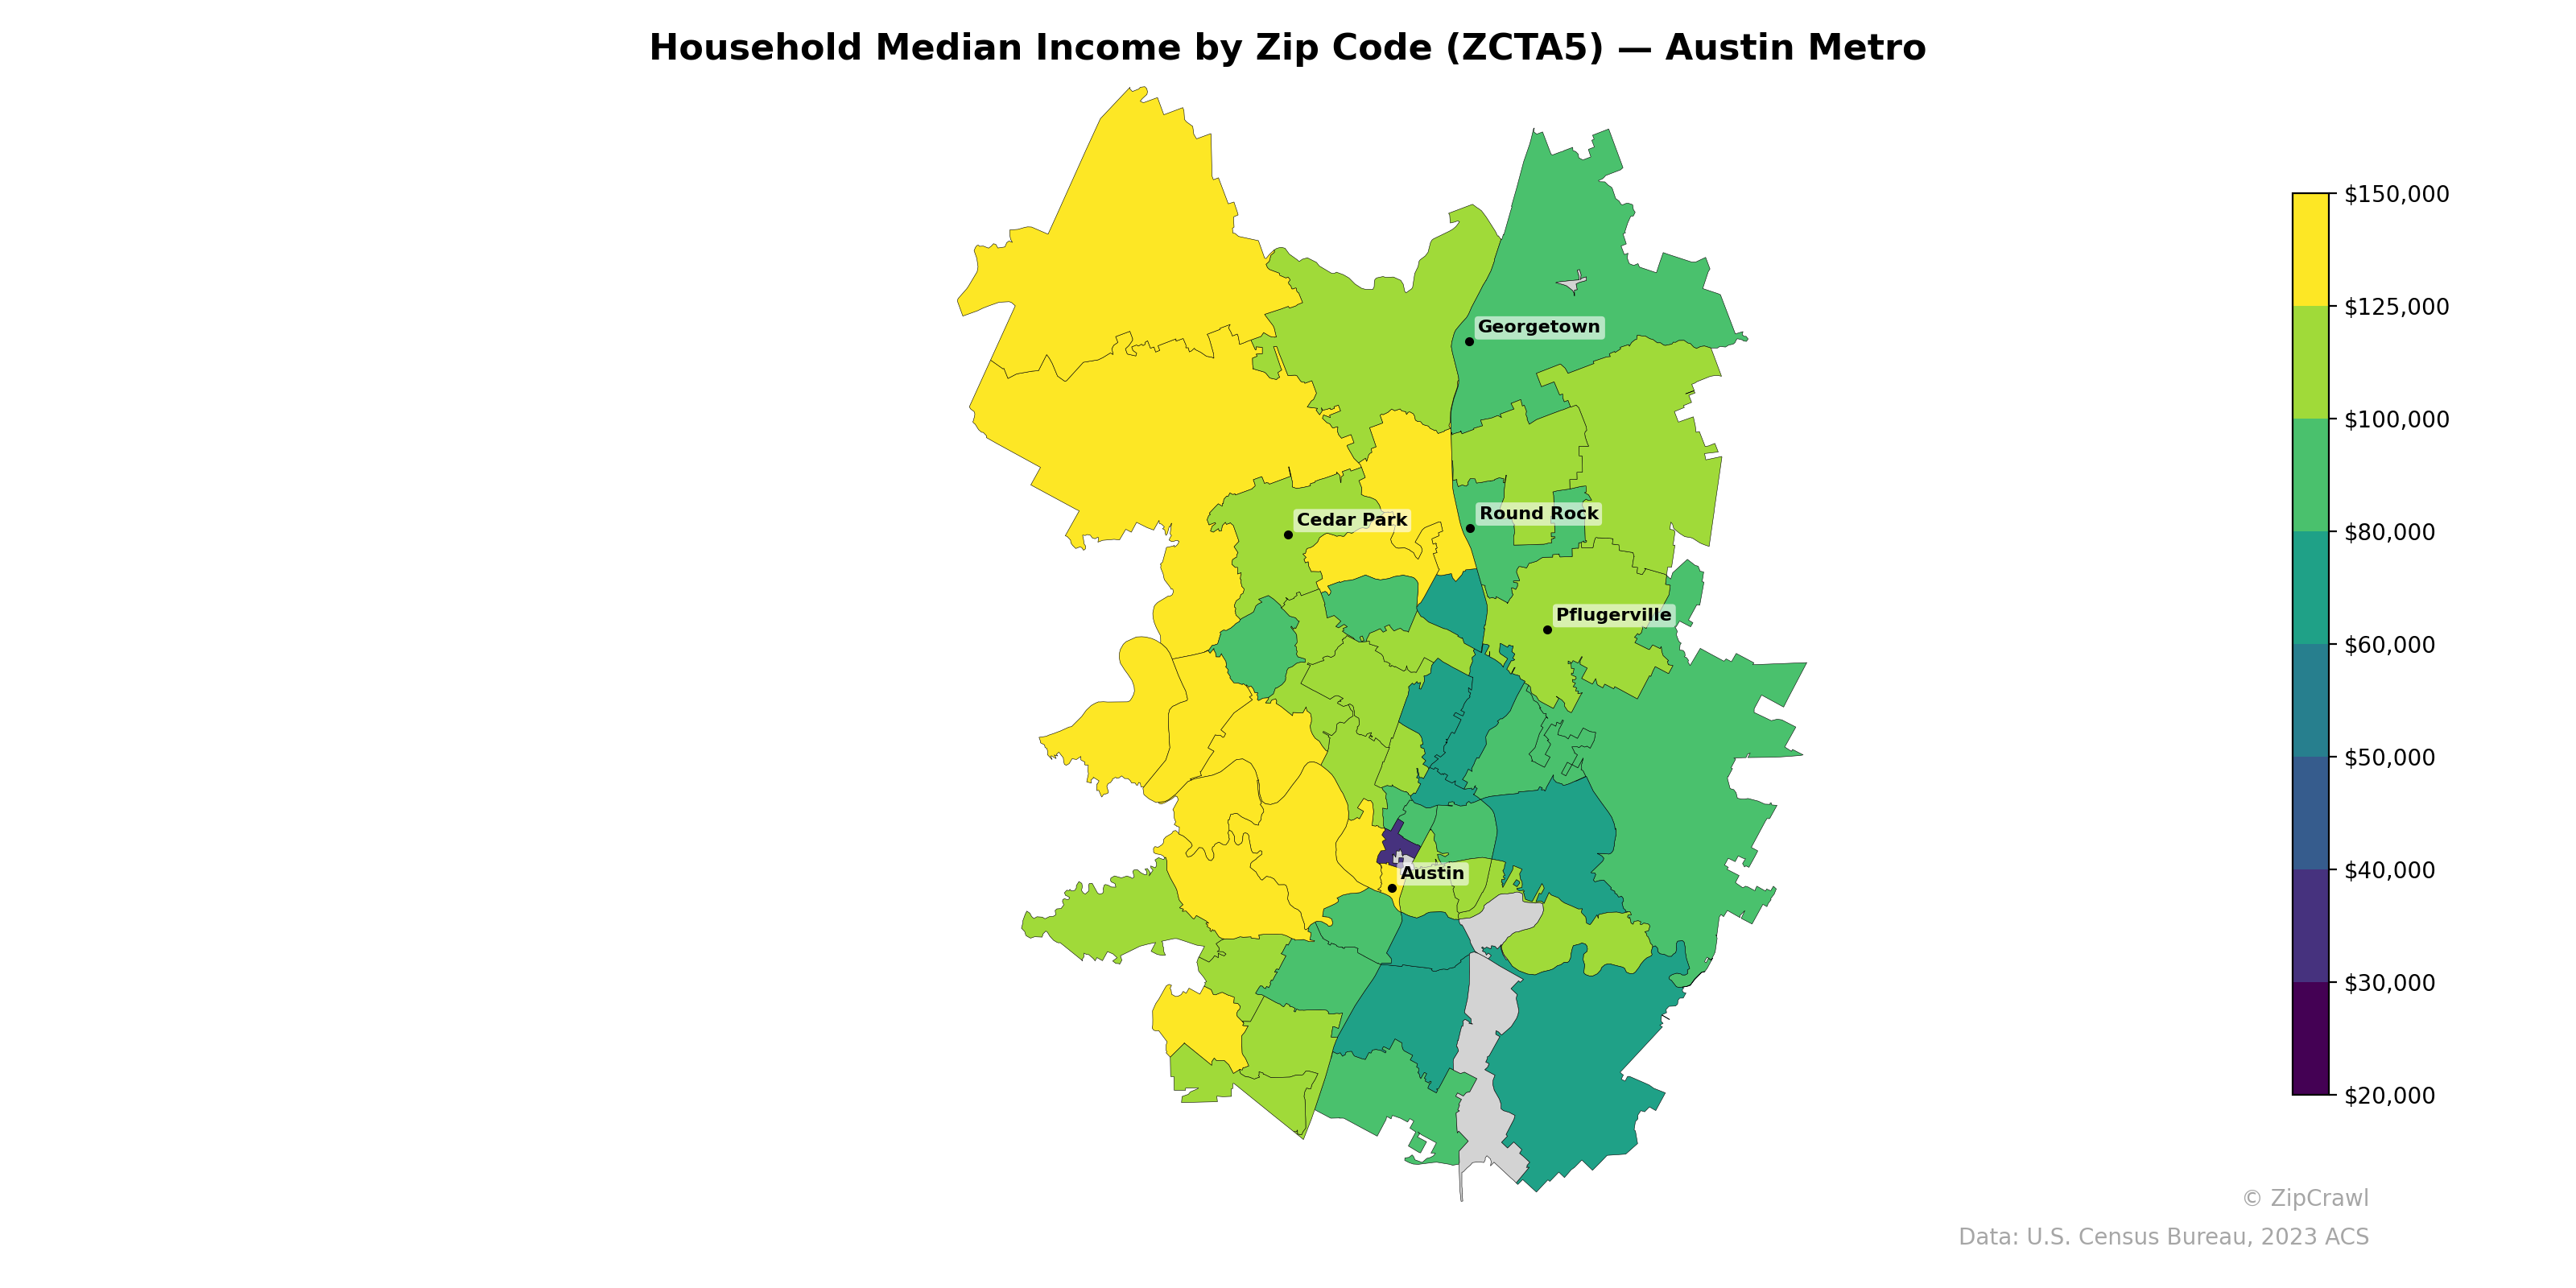
NOTE: Gray indicates insufficient data or a suppressed estimate.
The highest household median incomes, exceeding $125,000, concentrate in the northwestern and western zip codes stretching from Cedar Park through Georgetown, forming a pronounced affluence corridor along the I-35/US-183 growth axis. A sharp income gradient emerges near downtown Austin, where a small cluster of zip codes dips below $30,000—likely corresponding to the university and East Riverside areas—contrasting starkly with adjacent western zip codes reporting incomes two to four times higher. Suburban communities to the east and northeast, including Pflugerville and portions of Round Rock, occupy a middle band roughly between $60,000 and $90,000, reflecting the more moderate-income suburban development patterns on that side of the metro.
Data: U.S. Census Bureau, 2023 ACS
Explore
- Population Hispanic % by Zip Code (ZCTA5) — Texas
- High School Graduate (% of Over 25) by Zip Code (ZCTA5) — Austin Metro
- Population Non-Hispanic Asian % by Zip Code (ZCTA5) — San Antonio Metro
- Population Non-Hispanic White % by Zip Code (ZCTA5) — Austin Metro
- Population Hispanic % by Zip Code (ZCTA5) — Austin Metro
- Median Age by Zip Code (ZCTA5) — Austin Metro
- Population Non-Hispanic Black % by Zip Code (ZCTA5) — Austin Metro
- U.S. Citizens (% of Population Over 18) by Zip Code (ZCTA5) — Austin Metro
- % of Population on Food Stamps or SNAP (Last 12 Months), by Zip Code (ZCTA5) — San Antonio Metro
- Population Non-Hispanic American Indian % by Zip Code (ZCTA5) — Austin Metro
- High School Graduate (% of Over 25) by County
- Population Non-Hispanic White % by Zip Code (ZCTA5) — Texas
- U.S. Citizens (% of Population Over 18) by Zip Code (ZCTA5) — Texas
- Population Non-Hispanic Asian % by Zip Code (ZCTA5) — Chicago Metro
- % of Population on Food Stamps or SNAP (Last 12 Months), by Zip Code (ZCTA5) — Chicago Metro
- Population Non-Hispanic Black % by Zip Code (ZCTA5) — Texas
- Population Non-Hispanic American Indian % by Zip Code (ZCTA5) — Texas
- High School Graduate (% of Over 25) by Zip Code (ZCTA5) — Texas
- Median Age by Zip Code (ZCTA5) — Texas
- Housing Owner-Occupied % of Units, by Zip Code (ZCTA5) — Baltimore Metro
- % of Population without Health Insurance, by Zip Code (ZCTA5) — Baltimore Metro
- Housing Owner-Occupied Median Value ($), by Zip Code (ZCTA5) — Baltimore Metro
- % of Population on Food Stamps or SNAP (Last 12 Months), by Zip Code (ZCTA5) — Charlotte Metro
- High School Graduate (% of Over 25) by Zip Code (ZCTA5) — Baltimore Metro
- Population Non-Hispanic Asian % by Zip Code (ZCTA5) — Baltimore Metro
- U.S. Citizens (% of Population Over 18) by Zip Code (ZCTA5) — Baltimore Metro
- Population Non-Hispanic American Indian % by Zip Code (ZCTA5) — Baltimore Metro
- % of Households with Broadband Internet, by Zip Code (ZCTA5) — Baltimore Metro
- Population Non-Hispanic Asian % by Zip Code (ZCTA5) — Charlotte Metro
- Bachelor's Degree or Higher (% of Over 25) by Zip Code (ZCTA5) — Baltimore Metro
- Household Median Income by Zip Code (ZCTA5) — Houston Metro
- Household Median Income by Zip Code (ZCTA5) — Miami Metro
- Household Median Income by Zip Code (ZCTA5) — Atlanta Metro
- Household Median Income by Zip Code (ZCTA5) — Detroit Metro
- Household Median Income by Zip Code (ZCTA5) — Boston Metro
- Household Median Income by Zip Code (ZCTA5) — Tampa Metro
- Household Median Income by Zip Code (ZCTA5) — Dallas Metro
- Household Median Income by Zip Code (ZCTA5) — Chicago Metro
- Household Median Income by Zip Code (ZCTA5) — Denver Metro
- Household Median Income by Zip Code (ZCTA5) — Phoenix Metro