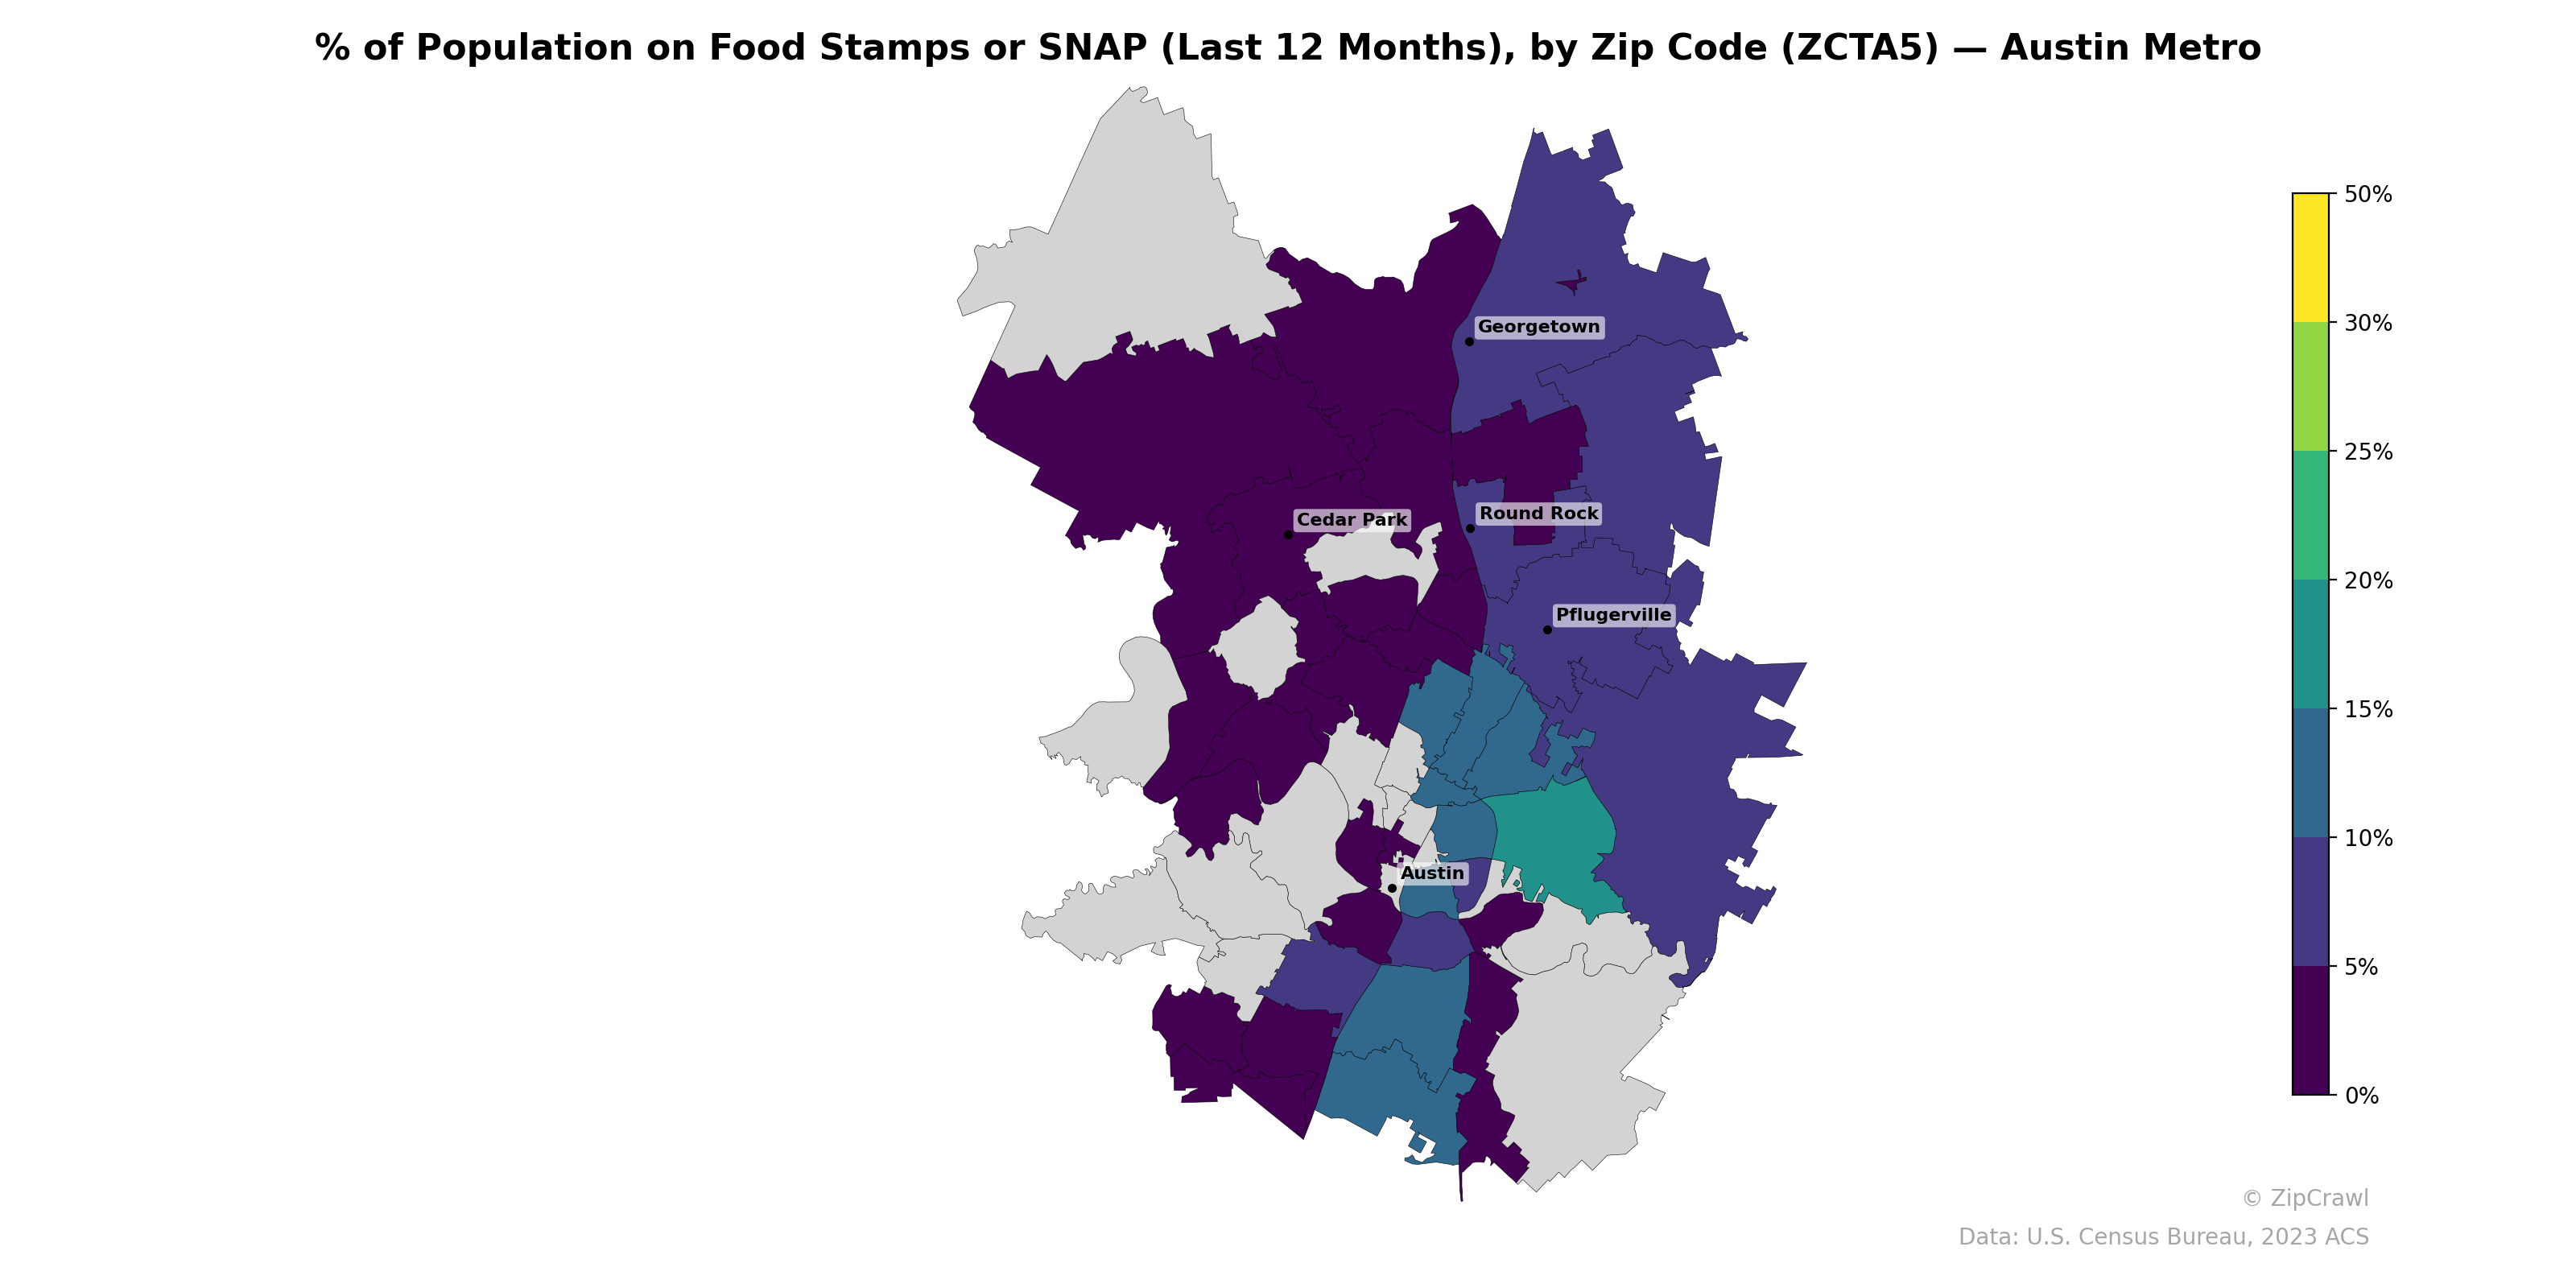
NOTE: Gray indicates insufficient data or a suppressed estimate.
The highest SNAP participation rates in the Austin metro, reaching 15–20% or above, concentrate in zip codes east and northeast of downtown Austin, forming a distinct corridor that contrasts sharply with the near-zero rates in western and southwestern zip codes closer to the Hill Country. Suburban communities such as Cedar Park, Round Rock, and Georgetown generally display low to moderate SNAP usage, while several zip codes in the far northern and eastern periphery of the metro show elevated rates in the 10–15% range. This east-west divide mirrors well-documented income and demographic disparities across the Austin region, with western areas consistently exhibiting lower public assistance utilization.
Data: U.S. Census Bureau, 2023 ACS
Explore
- Population Non-Hispanic American Indian % by Zip Code (ZCTA5) — Texas
- Population Non-Hispanic American Indian % by Zip Code (ZCTA5) — Portland Metro
- Population Hispanic % by Zip Code (ZCTA5) — Portland Metro
- Median Age by Zip Code (ZCTA5) — Portland Metro
- Population Non-Hispanic White % by Zip Code (ZCTA5) — Portland Metro
- Household Median Income by Zip Code (ZCTA5) — Portland Metro
- Population Non-Hispanic Black % by Zip Code (ZCTA5) — Portland Metro
- U.S. Citizens (% of Population Over 18) by Zip Code (ZCTA5) — Portland Metro
- Population Non-Hispanic Asian % by Zip Code (ZCTA5) — Austin Metro
- High School Graduate (% of Over 25) by Zip Code (ZCTA5) — Portland Metro
- High School Graduate (% of Over 25) by County
- Population Non-Hispanic White % by Zip Code (ZCTA5) — Texas
- U.S. Citizens (% of Population Over 18) by Zip Code (ZCTA5) — Texas
- Population Non-Hispanic Asian % by Zip Code (ZCTA5) — Chicago Metro
- Household Median Income by Zip Code (ZCTA5) — Texas
- Population Non-Hispanic Black % by Zip Code (ZCTA5) — Texas
- Population Hispanic % by Zip Code (ZCTA5) — Texas
- Median Age by Zip Code (ZCTA5) — Texas
- High School Graduate (% of Over 25) by Zip Code (ZCTA5) — Texas
- Housing Owner-Occupied % of Units, by Zip Code (ZCTA5) — Baltimore Metro
- % of Population without Health Insurance, by Zip Code (ZCTA5) — Baltimore Metro
- Housing Owner-Occupied Median Value ($), by Zip Code (ZCTA5) — Baltimore Metro
- Population Non-Hispanic Asian % by Zip Code (ZCTA5) — Charlotte Metro
- Household Median Income by Zip Code (ZCTA5) — Baltimore Metro
- Population Non-Hispanic American Indian % by Zip Code (ZCTA5) — Baltimore Metro
- U.S. Citizens (% of Population Over 18) by Zip Code (ZCTA5) — Baltimore Metro
- Bachelor's Degree or Higher (% of Over 25) by Zip Code (ZCTA5) — Baltimore Metro
- % of Households with Broadband Internet, by Zip Code (ZCTA5) — Baltimore Metro
- Population Non-Hispanic Black % by Zip Code (ZCTA5) — Baltimore Metro
- Population Non-Hispanic Asian % by Zip Code (ZCTA5) — Baltimore Metro
- % of Population on Food Stamps or SNAP (Last 12 Months), by Zip Code (ZCTA5) — Tampa Metro
- % of Population on Food Stamps or SNAP (Last 12 Months), by Zip Code (ZCTA5) — Houston Metro
- % of Population on Food Stamps or SNAP (Last 12 Months), by Zip Code (ZCTA5) — St. Louis Metro
- % of Population on Food Stamps or SNAP (Last 12 Months), by Zip Code (ZCTA5) — Boston Metro
- % of Population on Food Stamps or SNAP (Last 12 Months), by Zip Code (ZCTA5) — Miami Metro
- % of Population on Food Stamps or SNAP (Last 12 Months), by Zip Code (ZCTA5) — Atlanta Metro
- % of Population on Food Stamps or SNAP (Last 12 Months), by Zip Code (ZCTA5) — Detroit Metro
- % of Population on Food Stamps or SNAP (Last 12 Months), by Zip Code (ZCTA5) — Dallas Metro
- % of Population on Food Stamps or SNAP (Last 12 Months), by Zip Code (ZCTA5) — Orlando Metro
- % of Population on Food Stamps or SNAP (Last 12 Months), by Zip Code (ZCTA5) — Phoenix Metro