NOTE: Gray indicates insufficient data or a suppressed estimate.
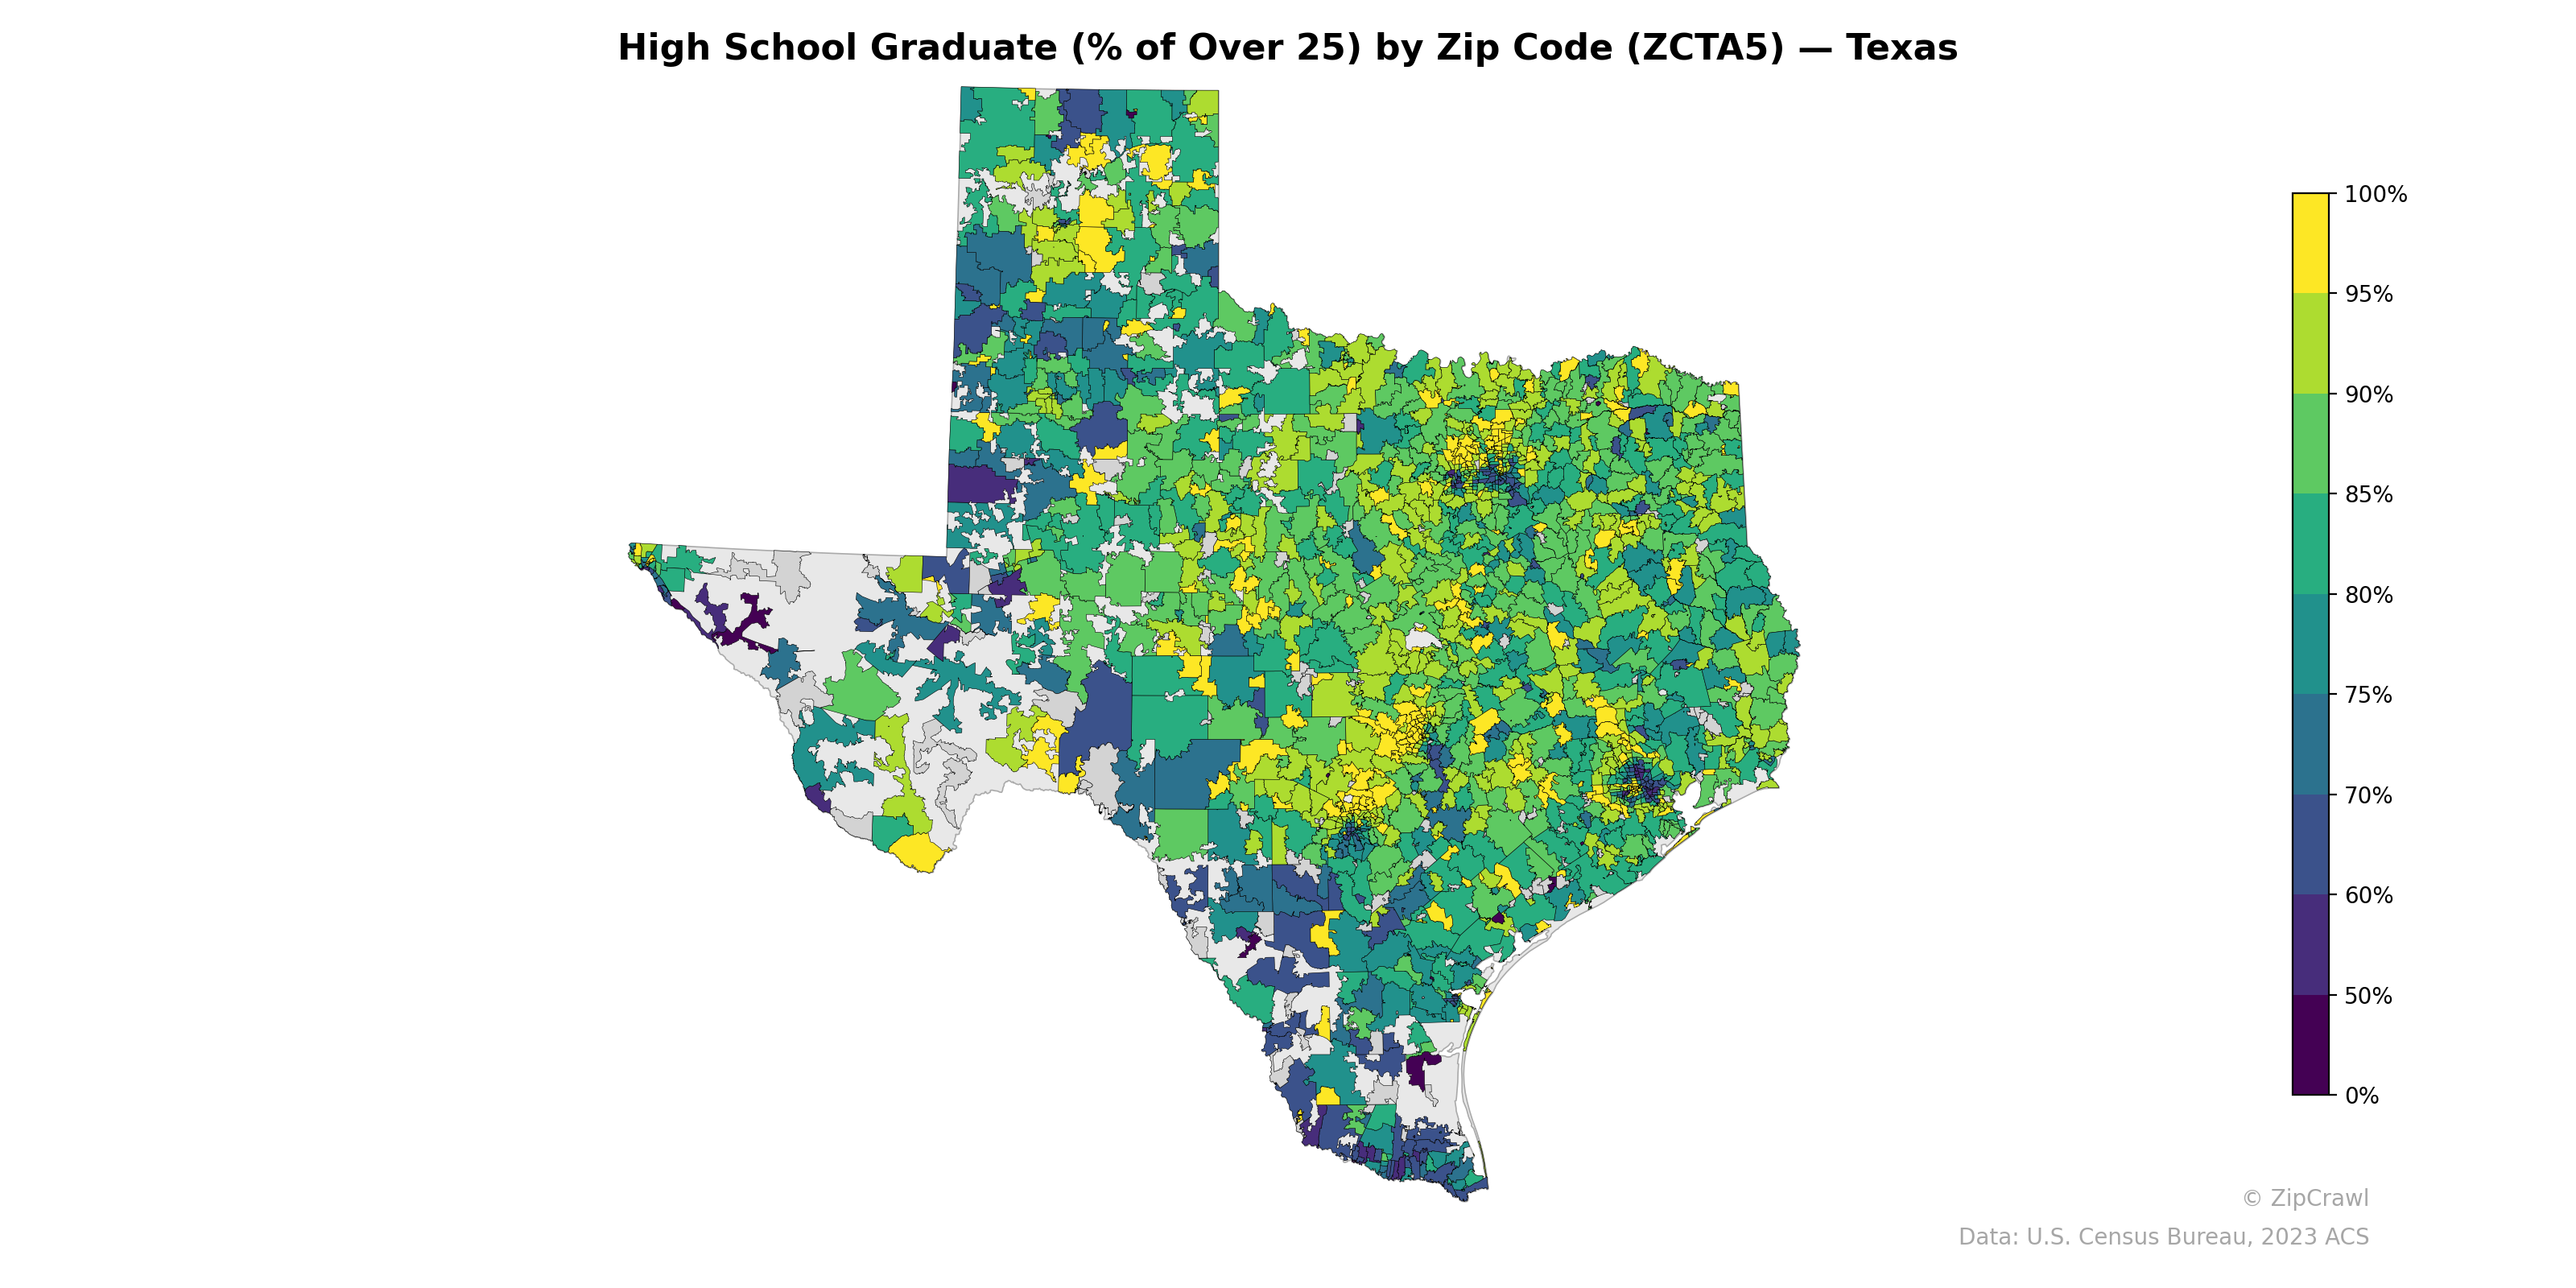
The Texas-Mexico border region exhibits consistently low high school graduation rates, with many zip codes in the Rio Grande Valley and El Paso area falling below 60%, reflecting longstanding educational attainment gaps in predominantly Hispanic border communities. The Dallas-Fort Worth and Austin metropolitan areas display sharp intra-urban contrasts, with suburban zip codes reaching above 95% while adjacent urban core areas drop significantly, highlighting socioeconomic segregation within major metros. Rural areas of the Panhandle and West Texas show considerable variability, with pockets of high attainment interspersed among zip codes in the 70-80% range, likely corresponding to differences in agricultural community demographics and economic base.
Data: U.S. Census Bureau, 2023 ACS
Explore
- Housing % of Units Built Since 2010, by Zip Code (ZCTA5) — Portland Metro
- Household Average Size by Zip Code (ZCTA5) — Portland Metro
- Married Couple (% of all Households) by Zip Code (ZCTA5) — Portland Metro
- Housing Median Monthly Rent ($), by Zip Code (ZCTA5) — Portland Metro
- Housing Vacancy Rate by Zip Code (ZCTA5) — Portland Metro
- % of Households with Broadband Internet, by Zip Code (ZCTA5) — Portland Metro
- Bachelor's Degree or Higher (% of Over 25) by Zip Code (ZCTA5) — Portland Metro
- Housing Owner-Occupied Median Value ($), by Zip Code (ZCTA5) — Portland Metro
- Housing Owner-Occupied % of Units, by Zip Code (ZCTA5) — Portland Metro
- % of Population without Health Insurance, by Zip Code (ZCTA5) — Portland Metro
- Population Non-Hispanic White % by Zip Code (ZCTA5) — Texas
- U.S. Citizens (% of Population Over 18) by Zip Code (ZCTA5) — Texas
- Population Non-Hispanic Asian % by Zip Code (ZCTA5) — Chicago Metro
- Household Median Income by Zip Code (ZCTA5) — Texas
- Median Age by Zip Code (ZCTA5) — Texas
- Population Hispanic % by Zip Code (ZCTA5) — Texas
- Population Non-Hispanic Black % by Zip Code (ZCTA5) — Texas
- Population Non-Hispanic American Indian % by Zip Code (ZCTA5) — Texas
- % of Population on Food Stamps or SNAP (Last 12 Months), by Zip Code (ZCTA5) — Chicago Metro
- Housing Median Monthly Rent ($), by Zip Code (ZCTA5) — Baltimore Metro
- Housing Owner-Occupied % of Units, by Zip Code (ZCTA5) — Baltimore Metro
- Housing % of Units Built Since 2010, by Zip Code (ZCTA5) — Baltimore Metro
- U.S. Citizens (% of Population Over 18) by Zip Code (ZCTA5) — Baltimore Metro
- Bachelor's Degree or Higher (% of Over 25) by Zip Code (ZCTA5) — Baltimore Metro
- Population Non-Hispanic Asian % by Zip Code (ZCTA5) — Charlotte Metro
- Household Median Income by Zip Code (ZCTA5) — Baltimore Metro
- % of Population without Health Insurance, by Zip Code (ZCTA5) — Baltimore Metro
- Population Non-Hispanic Asian % by Zip Code (ZCTA5) — Baltimore Metro
- Housing Owner-Occupied Median Value ($), by Zip Code (ZCTA5) — Baltimore Metro
- % of Population on Food Stamps or SNAP (Last 12 Months), by Zip Code (ZCTA5) — Charlotte Metro
- High School Graduate (% of Over 25) by Zip Code (ZCTA5) — Ohio
- High School Graduate (% of Over 25) by Zip Code (ZCTA5) — Kansas
- High School Graduate (% of Over 25) by Zip Code (ZCTA5) — Utah
- High School Graduate (% of Over 25) by Zip Code (ZCTA5) — Iowa
- High School Graduate (% of Over 25) by Zip Code (ZCTA5) — Tennessee
- High School Graduate (% of Over 25) by Zip Code (ZCTA5) — Idaho
- High School Graduate (% of Over 25) by Zip Code (ZCTA5) — Colorado
- High School Graduate (% of Over 25) by Zip Code (ZCTA5) — Hawaii
- High School Graduate (% of Over 25) by Zip Code (ZCTA5) — Oregon
- High School Graduate (% of Over 25) by Zip Code (ZCTA5) — Maine