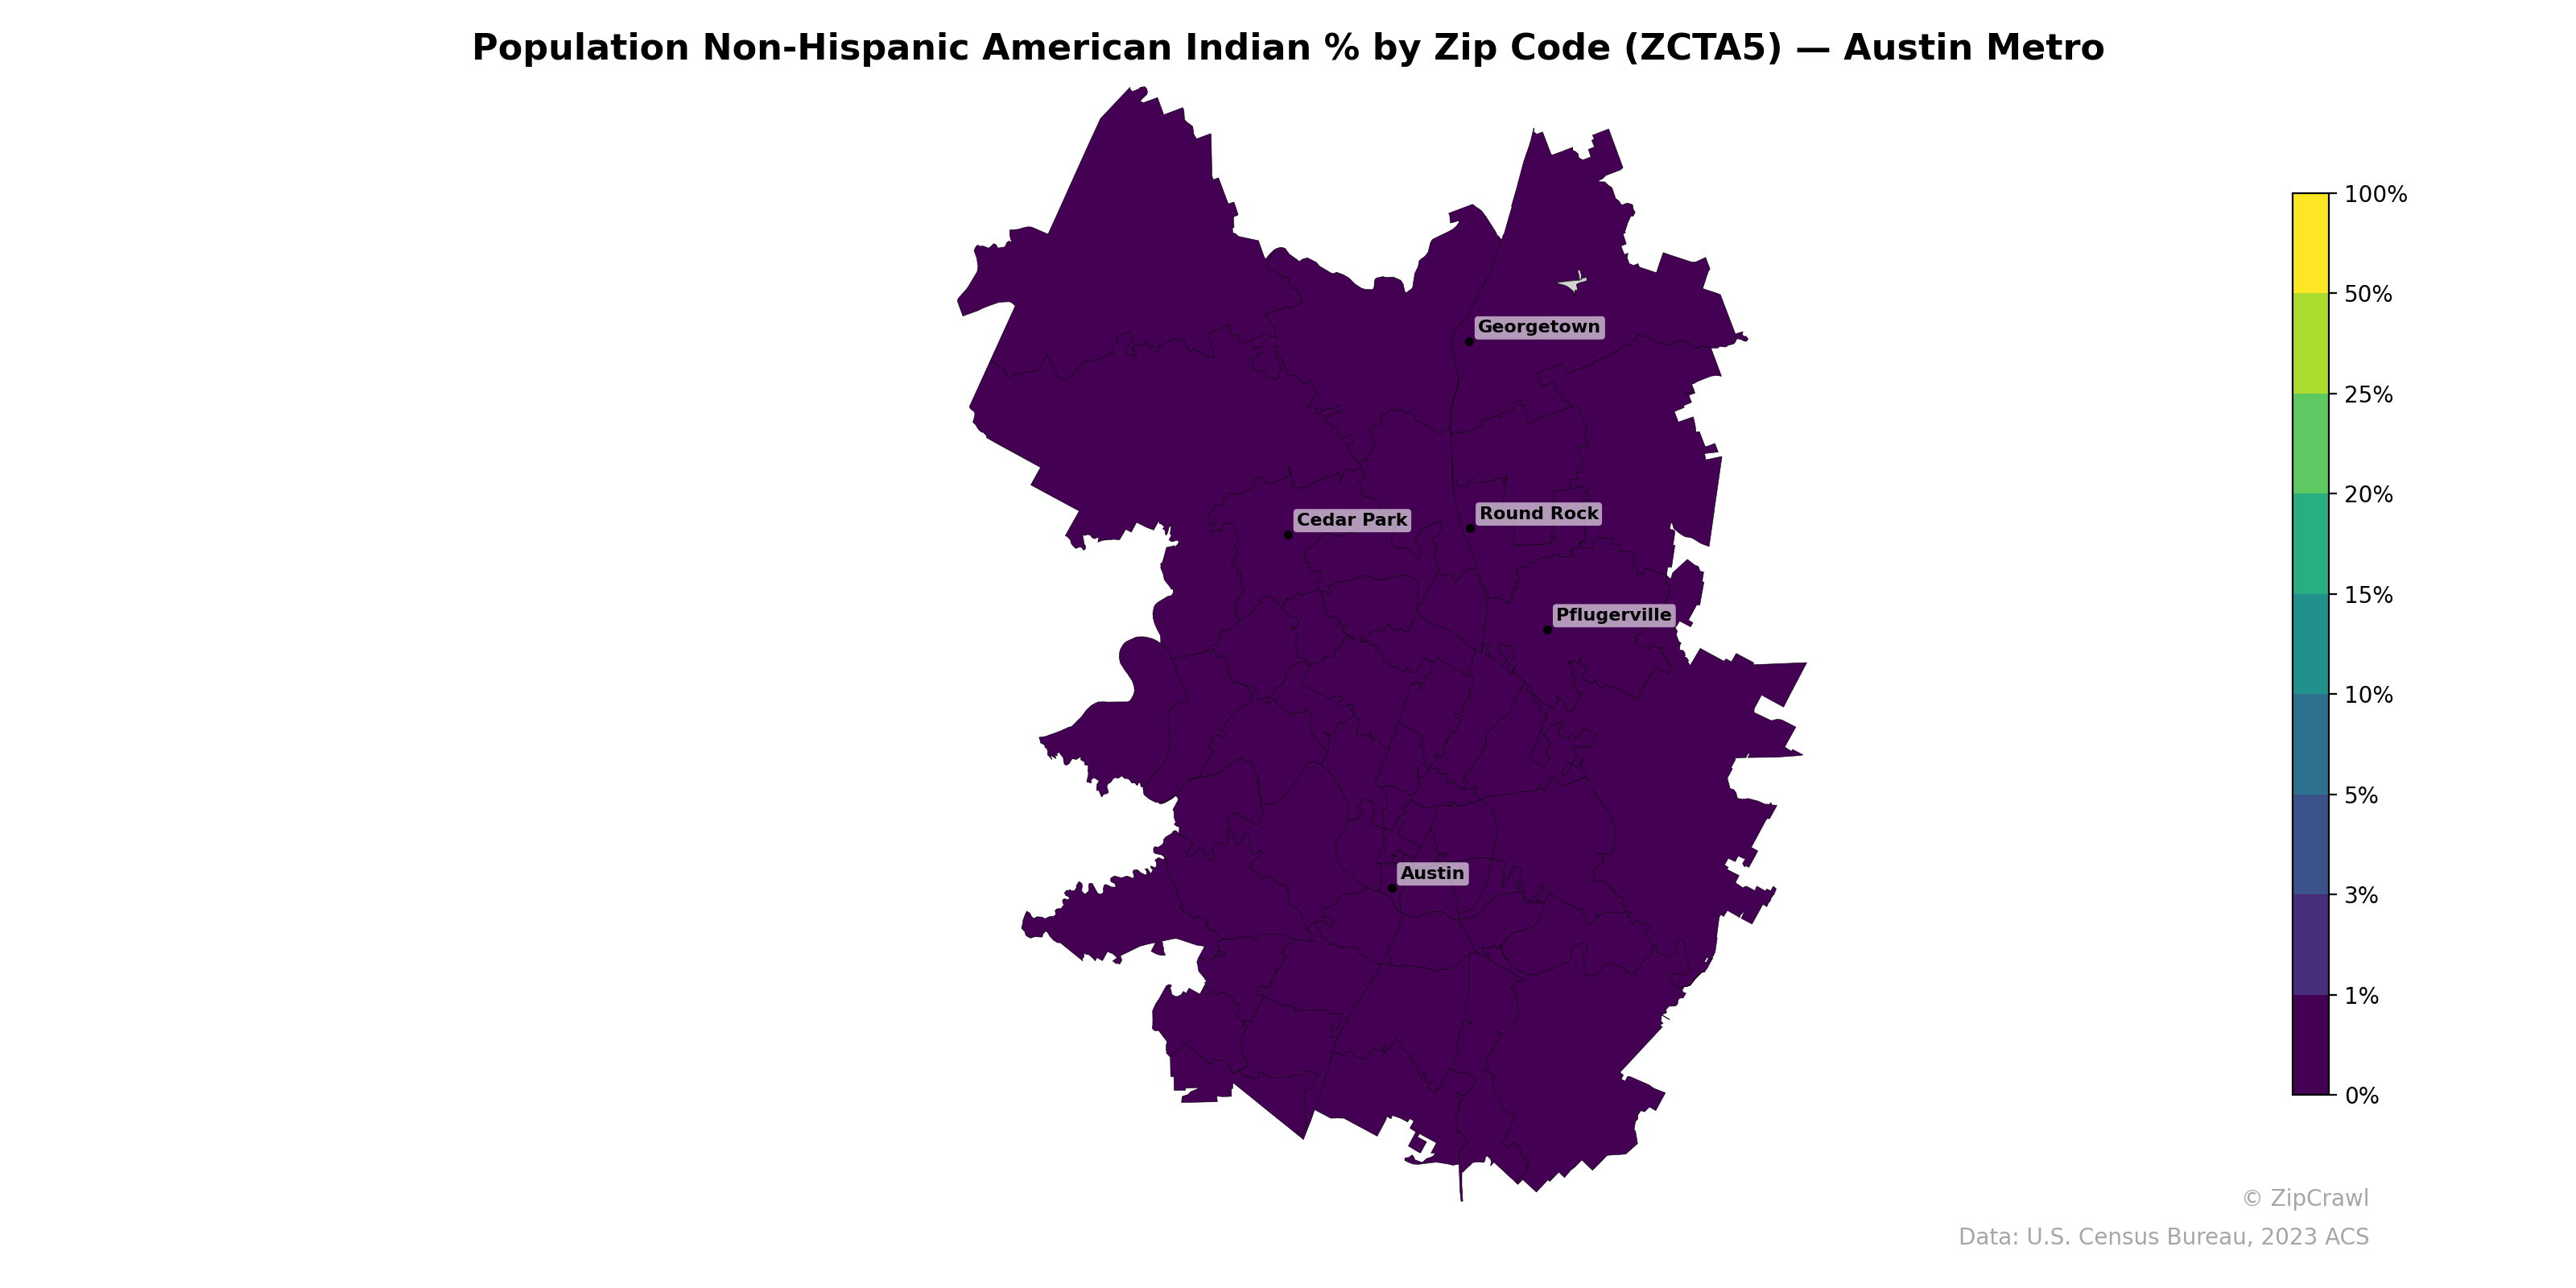
NOTE: Gray indicates insufficient data or a suppressed estimate.
The Non-Hispanic American Indian population percentage across the Austin metro area is uniformly low, with virtually all zip codes registering at or near 0%, as indicated by the consistently dark purple shading throughout the region. No meaningful spatial clustering or geographic gradient is discernible, suggesting this demographic group is neither concentrated in urban core zip codes near Austin nor in the more suburban or exurban areas around Georgetown, Cedar Park, or Pflugerville. This even distribution at very low levels reflects the relatively small Non-Hispanic American Indian population share across the entire metro, with no zip code appearing to exceed even the 1% threshold on the color scale.
Data: U.S. Census Bureau, 2023 ACS
Explore
- Population Hispanic % by Zip Code (ZCTA5) — Texas
- High School Graduate (% of Over 25) by Zip Code (ZCTA5) — Austin Metro
- Population Non-Hispanic Asian % by Zip Code (ZCTA5) — San Antonio Metro
- Median Age by Zip Code (ZCTA5) — Austin Metro
- Population Non-Hispanic White % by Zip Code (ZCTA5) — Austin Metro
- Household Median Income by Zip Code (ZCTA5) — Austin Metro
- Population Hispanic % by Zip Code (ZCTA5) — Austin Metro
- U.S. Citizens (% of Population Over 18) by Zip Code (ZCTA5) — Austin Metro
- % of Population on Food Stamps or SNAP (Last 12 Months), by Zip Code (ZCTA5) — San Antonio Metro
- Population Non-Hispanic Black % by Zip Code (ZCTA5) — Austin Metro
- High School Graduate (% of Over 25) by County
- Population Non-Hispanic White % by Zip Code (ZCTA5) — Texas
- U.S. Citizens (% of Population Over 18) by Zip Code (ZCTA5) — Texas
- Population Non-Hispanic Asian % by Zip Code (ZCTA5) — Chicago Metro
- % of Population on Food Stamps or SNAP (Last 12 Months), by Zip Code (ZCTA5) — Chicago Metro
- Population Non-Hispanic Black % by Zip Code (ZCTA5) — Texas
- High School Graduate (% of Over 25) by Zip Code (ZCTA5) — Texas
- Household Median Income by Zip Code (ZCTA5) — Texas
- Median Age by Zip Code (ZCTA5) — Texas
- Housing Owner-Occupied % of Units, by Zip Code (ZCTA5) — Baltimore Metro
- % of Households with Broadband Internet, by Zip Code (ZCTA5) — Baltimore Metro
- Housing Owner-Occupied Median Value ($), by Zip Code (ZCTA5) — Baltimore Metro
- U.S. Citizens (% of Population Over 18) by Zip Code (ZCTA5) — Baltimore Metro
- High School Graduate (% of Over 25) by Zip Code (ZCTA5) — Baltimore Metro
- Population Non-Hispanic Asian % by Zip Code (ZCTA5) — Charlotte Metro
- Household Median Income by Zip Code (ZCTA5) — Baltimore Metro
- Population Non-Hispanic Asian % by Zip Code (ZCTA5) — Baltimore Metro
- % of Population on Food Stamps or SNAP (Last 12 Months), by Zip Code (ZCTA5) — Charlotte Metro
- % of Population without Health Insurance, by Zip Code (ZCTA5) — Baltimore Metro
- Bachelor's Degree or Higher (% of Over 25) by Zip Code (ZCTA5) — Baltimore Metro
- Population Non-Hispanic American Indian % by Zip Code (ZCTA5) — Houston Metro
- Population Non-Hispanic American Indian % by Zip Code (ZCTA5) — Miami Metro
- Population Non-Hispanic American Indian % by Zip Code (ZCTA5) — Boston Metro
- Population Non-Hispanic American Indian % by Zip Code (ZCTA5) — Detroit Metro
- Population Non-Hispanic American Indian % by Zip Code (ZCTA5) — Chicago Metro
- Population Non-Hispanic American Indian % by Zip Code (ZCTA5) — Tampa Metro
- Population Non-Hispanic American Indian % by Zip Code (ZCTA5) — Denver Metro
- Population Non-Hispanic American Indian % by Zip Code (ZCTA5) — Atlanta Metro
- Population Non-Hispanic American Indian % by Zip Code (ZCTA5) — Dallas Metro
- Population Non-Hispanic American Indian % by Zip Code (ZCTA5) — Phoenix Metro