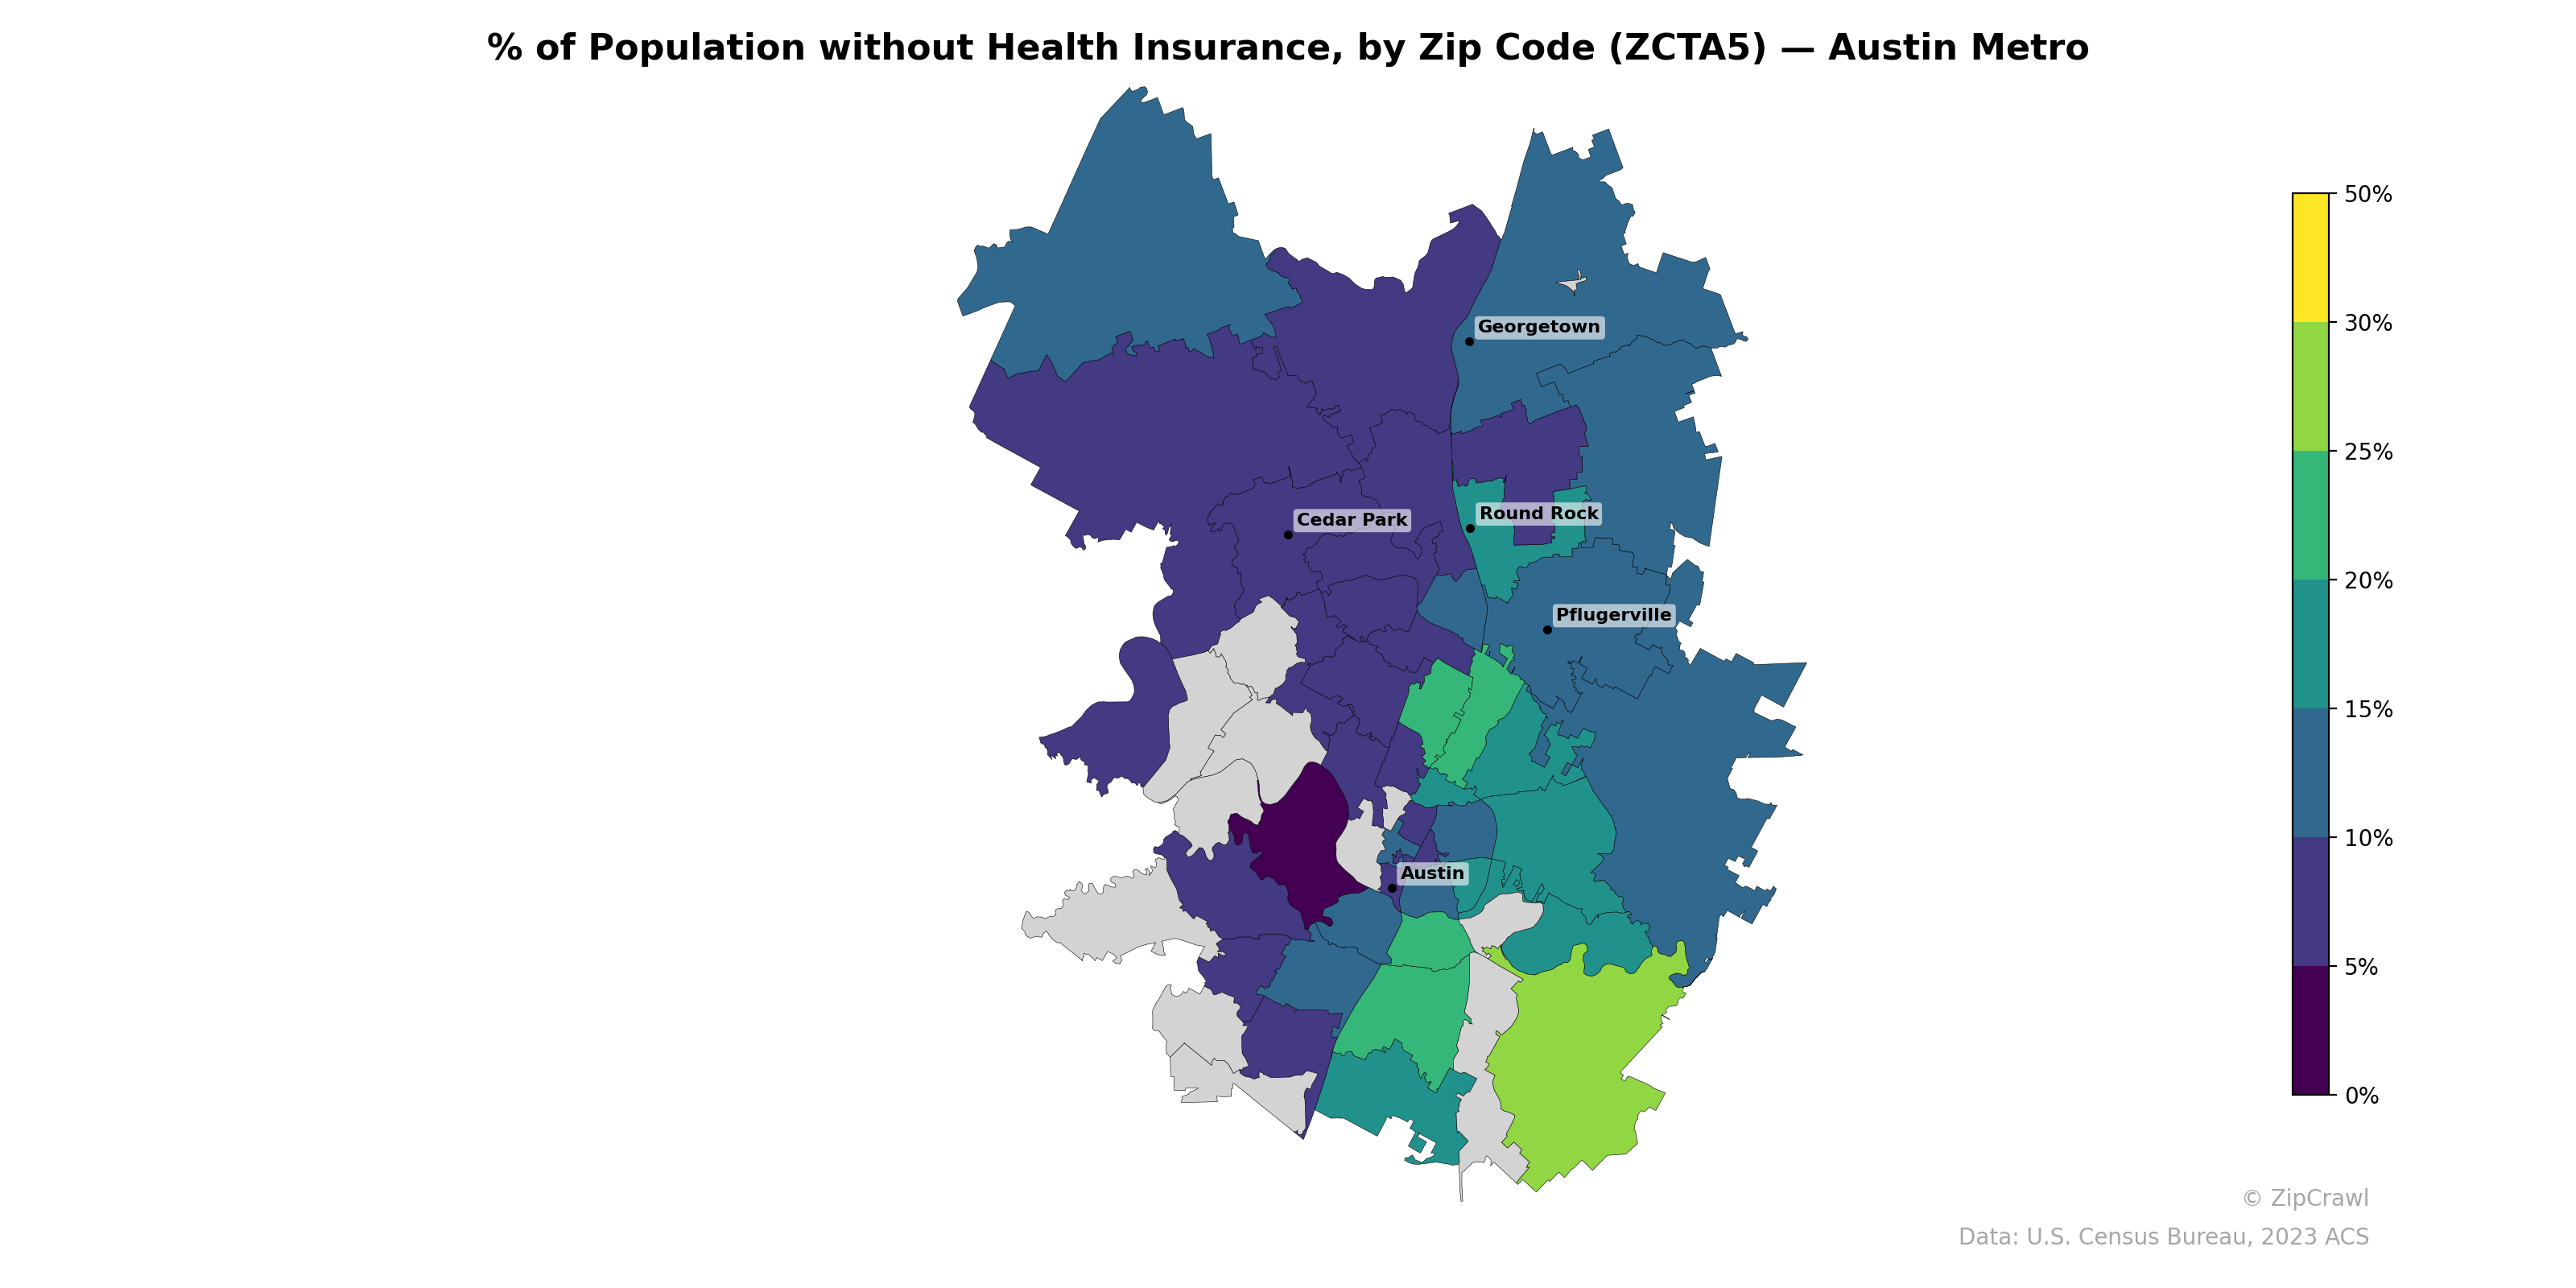
NOTE: Gray indicates insufficient data or a suppressed estimate.
Uninsured rates in the Austin metro area exhibit a clear north-south gradient, with the highest concentrations (25–35%+) clustered in zip codes along the southern periphery and southeast fringe, while northern suburban communities such as Cedar Park, Georgetown, and Round Rock generally fall in the 10–15% range. A notable pocket of very low uninsured rates (under 5%) appears in several west-central zip codes near Austin proper, likely reflecting higher-income areas with strong employer-sponsored coverage. The eastern corridor between Pflugerville and southeast Austin displays moderate-to-elevated uninsured levels (15–25%), suggesting a transitional zone where affordability and access barriers may be more pronounced.
Data: U.S. Census Bureau, 2023 ACS
Explore
- Population Non-Hispanic Black % by Zip Code (ZCTA5) — Texas
- Household Average Size by Zip Code (ZCTA5) — Austin Metro
- Housing Owner-Occupied Median Value ($), by Zip Code (ZCTA5) — Austin Metro
- Bachelor's Degree or Higher (% of Over 25) by Zip Code (ZCTA5) — Austin Metro
- % of Households with Broadband Internet, by Zip Code (ZCTA5) — Austin Metro
- Housing Median Monthly Rent ($), by Zip Code (ZCTA5) — Austin Metro
- Married Couple (% of all Households) by Zip Code (ZCTA5) — Austin Metro
- Housing Owner-Occupied % of Units, by Zip Code (ZCTA5) — Austin Metro
- Housing % of Units Built Since 2010, by Zip Code (ZCTA5) — Austin Metro
- Housing Vacancy Rate by Zip Code (ZCTA5) — Austin Metro
- High School Graduate (% of Over 25) by County
- U.S. Citizens (% of Population Over 18) by Zip Code (ZCTA5) — Texas
- Population Non-Hispanic White % by Zip Code (ZCTA5) — Texas
- Population Non-Hispanic Asian % by Zip Code (ZCTA5) — Chicago Metro
- High School Graduate (% of Over 25) by Zip Code (ZCTA5) — Texas
- % of Population on Food Stamps or SNAP (Last 12 Months), by Zip Code (ZCTA5) — Chicago Metro
- Population Hispanic % by Zip Code (ZCTA5) — Texas
- Median Age by Zip Code (ZCTA5) — Texas
- Population Non-Hispanic American Indian % by Zip Code (ZCTA5) — Texas
- Household Median Income by Zip Code (ZCTA5) — Texas
- % of Households with Broadband Internet, by Zip Code (ZCTA5) — Baltimore Metro
- Bachelor's Degree or Higher (% of Over 25) by Zip Code (ZCTA5) — Baltimore Metro
- Housing Owner-Occupied % of Units, by Zip Code (ZCTA5) — Baltimore Metro
- Population Non-Hispanic Asian % by Zip Code (ZCTA5) — Charlotte Metro
- Population Non-Hispanic Asian % by Zip Code (ZCTA5) — Baltimore Metro
- % of Population on Food Stamps or SNAP (Last 12 Months), by Zip Code (ZCTA5) — Charlotte Metro
- Household Median Income by Zip Code (ZCTA5) — Baltimore Metro
- High School Graduate (% of Over 25) by Zip Code (ZCTA5) — Baltimore Metro
- Population Non-Hispanic Black % by Zip Code (ZCTA5) — Baltimore Metro
- Population Non-Hispanic American Indian % by Zip Code (ZCTA5) — Baltimore Metro
- % of Population without Health Insurance, by Zip Code (ZCTA5) — Houston Metro
- % of Population without Health Insurance, by Zip Code (ZCTA5) — Miami Metro
- % of Population without Health Insurance, by Zip Code (ZCTA5) — Boston Metro
- % of Population without Health Insurance, by Zip Code (ZCTA5) — Atlanta Metro
- % of Population without Health Insurance, by Zip Code (ZCTA5) — Tampa Metro
- % of Population without Health Insurance, by Zip Code (ZCTA5) — Detroit Metro
- % of Population without Health Insurance, by Zip Code (ZCTA5) — Chicago Metro
- % of Population without Health Insurance, by Zip Code (ZCTA5) — Denver Metro
- % of Population without Health Insurance, by Zip Code (ZCTA5) — Phoenix Metro
- % of Population without Health Insurance, by Zip Code (ZCTA5) — Dallas Metro