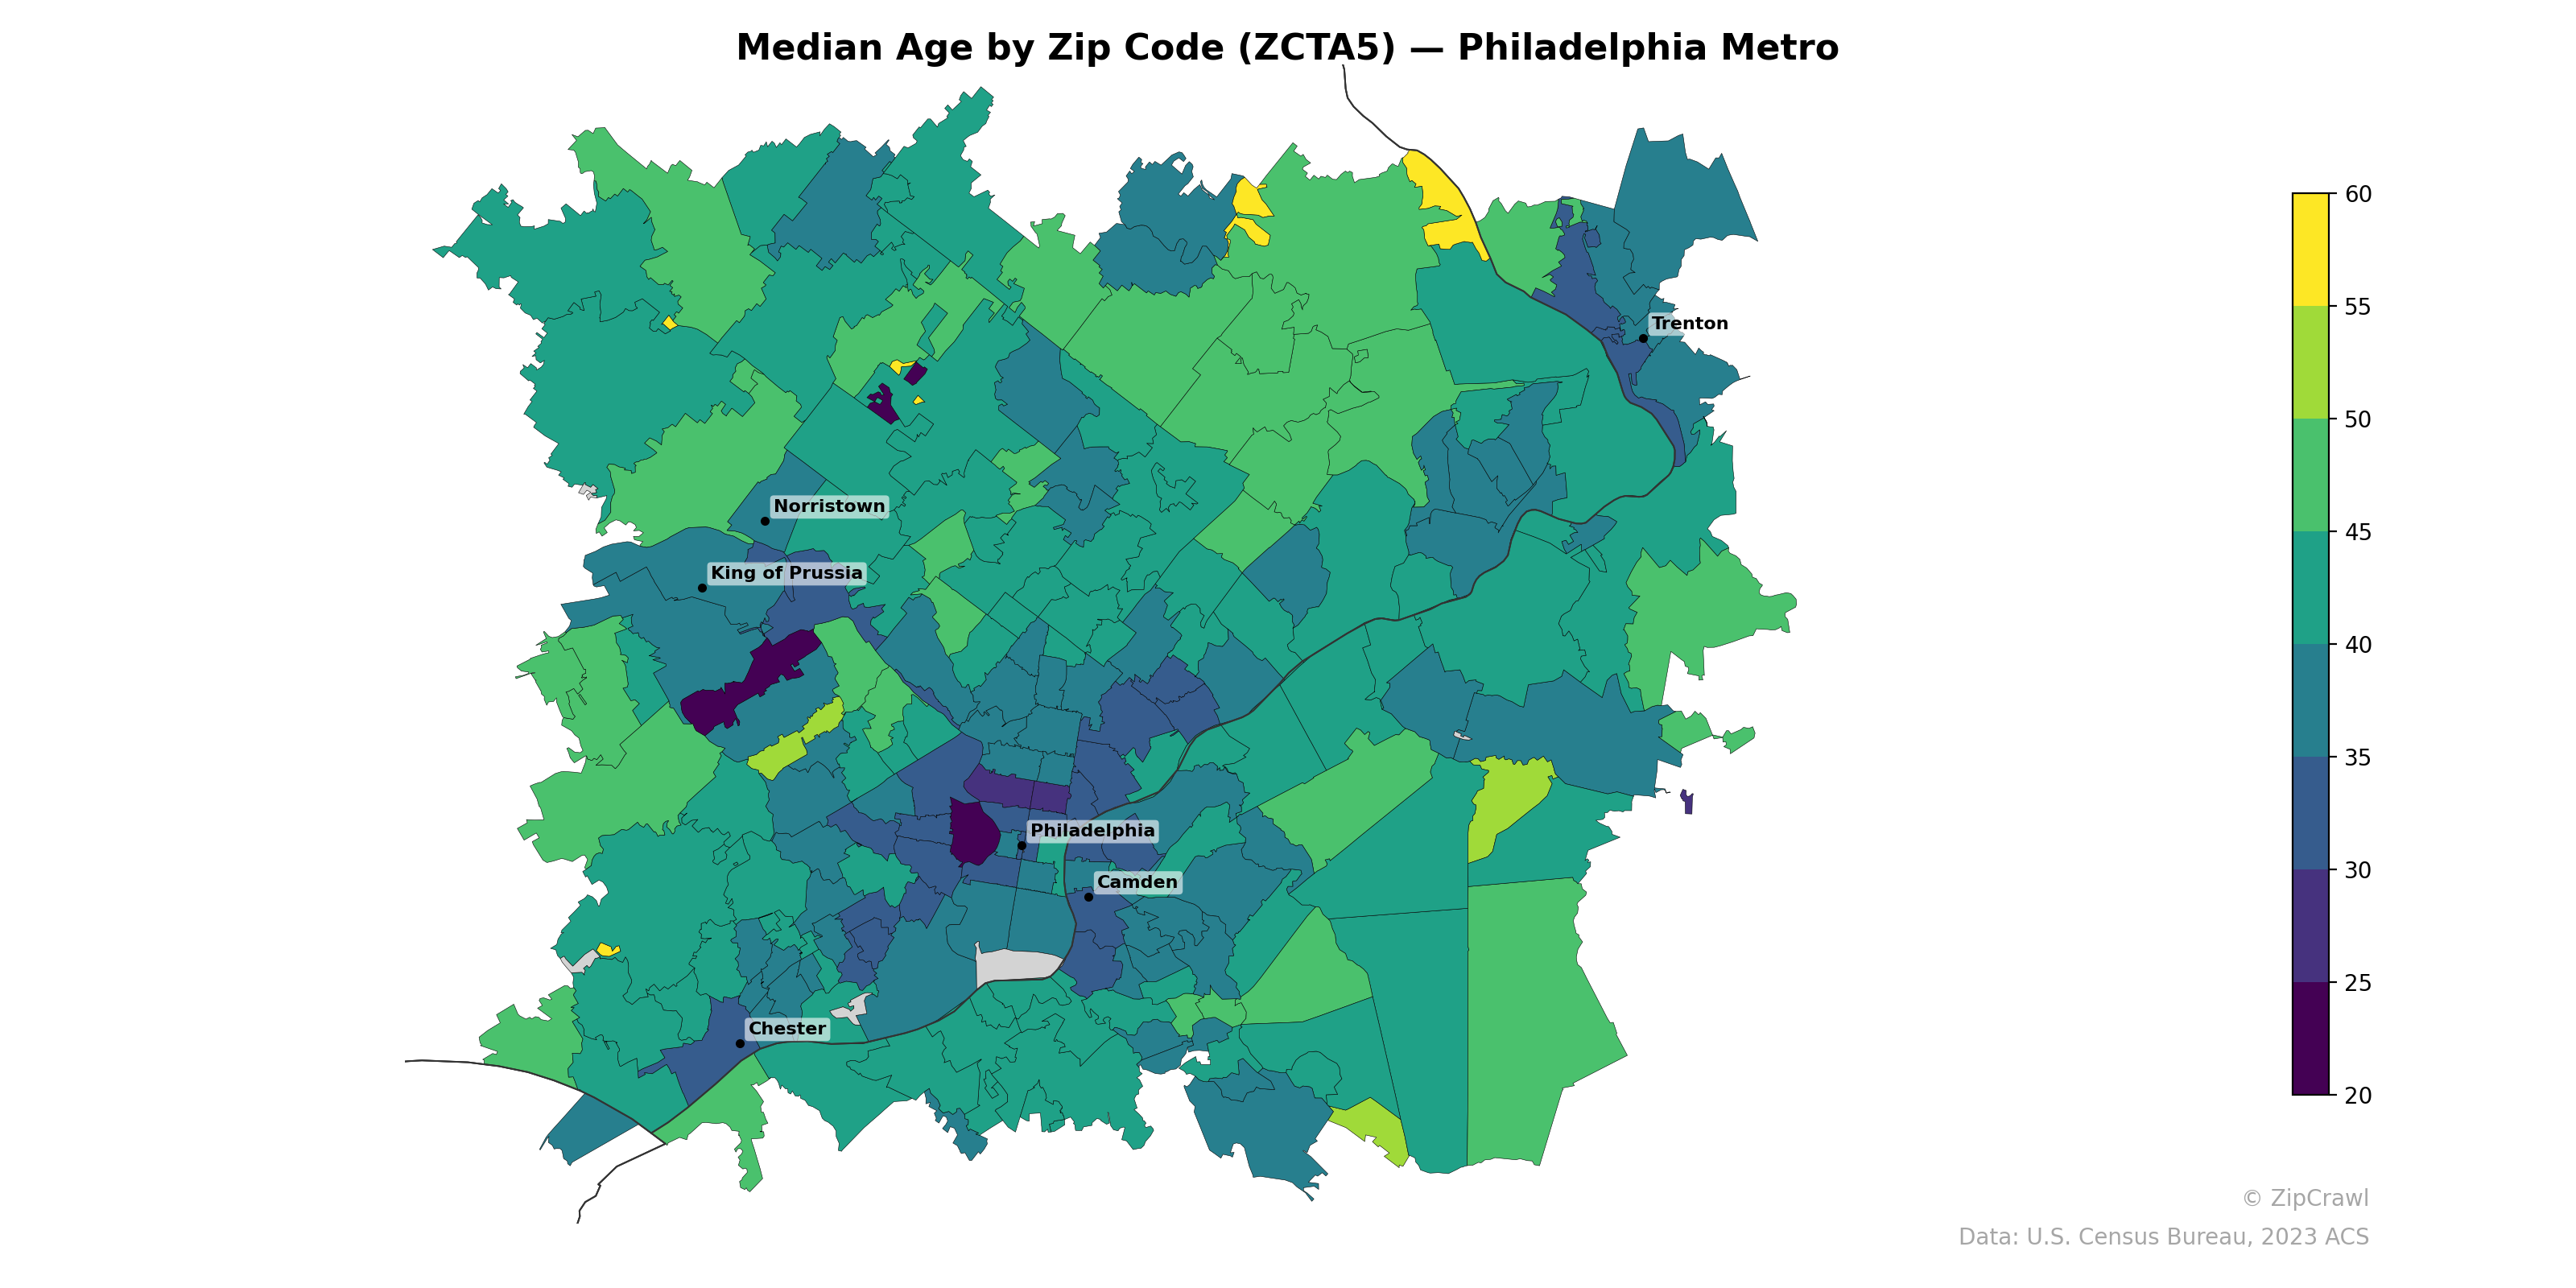
NOTE: Gray indicates insufficient data or a suppressed estimate.
The Philadelphia metro area exhibits a clear urban-suburban age gradient, with the youngest median ages (under 25) concentrated in zip codes near central Philadelphia, Camden, and Chester—areas likely influenced by university populations and younger urban demographics. Suburban zip codes in the outer ring, particularly to the northwest and north toward Bucks County, skew considerably older with median ages reaching into the mid-40s to upper 50s, while one zip code north of Norristown stands out with a median age exceeding 60. King of Prussia and the western Montgomery County corridor display moderate median ages in the 38–45 range, forming a transitional band between the younger urban core and the older exurban periphery.
Data: U.S. Census Bureau, 2023 ACS
Explore
- % of Population on Food Stamps or SNAP (Last 12 Months), by Zip Code (ZCTA5) — New York Metro
- Population Non-Hispanic American Indian % by Zip Code (ZCTA5) — Philadelphia Metro
- Population Non-Hispanic Black % by Zip Code (ZCTA5) — Philadelphia Metro
- % of Population on Food Stamps or SNAP (Last 12 Months), by Zip Code (ZCTA5) — Atlanta Metro
- Household Median Income by Zip Code (ZCTA5) — Philadelphia Metro
- Population Non-Hispanic Asian % by Zip Code (ZCTA5) — Atlanta Metro
- Population Non-Hispanic White % by Zip Code (ZCTA5) — Philadelphia Metro
- High School Graduate (% of Over 25) by Zip Code (ZCTA5) — Philadelphia Metro
- Population Hispanic % by Zip Code (ZCTA5) — Philadelphia Metro
- U.S. Citizens (% of Population Over 18) by Zip Code (ZCTA5) — Philadelphia Metro
- % of Population without Health Insurance, by Zip Code (ZCTA5) — West Virginia
- Population Hispanic % by County
- High School Graduate (% of Over 25) by Zip Code (ZCTA5) — Los Angeles Metro
- Population Non-Hispanic American Indian % by Zip Code (ZCTA5) — Los Angeles Metro
- Population Non-Hispanic Black % by Zip Code (ZCTA5) — Los Angeles Metro
- Population Non-Hispanic White % by Zip Code (ZCTA5) — Los Angeles Metro
- Household Median Income by Zip Code (ZCTA5) — Los Angeles Metro
- U.S. Citizens (% of Population Over 18) by Zip Code (ZCTA5) — Los Angeles Metro
- Population Hispanic % by Zip Code (ZCTA5) — Los Angeles Metro
- Married Couple (% of all Households) by Zip Code (ZCTA5) — Virginia
- Housing % of Units Built Since 2010, by Zip Code (ZCTA5) — Virginia
- Housing Vacancy Rate by Zip Code (ZCTA5) — Virginia
- Bachelor's Degree or Higher (% of Over 25) by Zip Code (ZCTA5) — Virginia
- % of Population without Health Insurance, by Zip Code (ZCTA5) — Virginia
- Population Non-Hispanic American Indian % by Zip Code (ZCTA5) — Virginia
- % of Households with Broadband Internet, by Zip Code (ZCTA5) — Virginia
- Housing Owner-Occupied Median Value ($), by Zip Code (ZCTA5) — Virginia
- Housing Median Monthly Rent ($), by Zip Code (ZCTA5) — Virginia
- Household Average Size by Zip Code (ZCTA5) — Virginia
- High School Graduate (% of Over 25) by Zip Code (ZCTA5) — Virginia
- Median Age by Zip Code (ZCTA5) — Phoenix Metro
- Median Age by Zip Code (ZCTA5) — Miami Metro
- Median Age by Zip Code (ZCTA5) — Boston Metro
- Median Age by Zip Code (ZCTA5) — Detroit Metro
- Median Age by Zip Code (ZCTA5) — Austin Metro
- Median Age by Zip Code (ZCTA5) — Tampa Metro
- Median Age by Zip Code (ZCTA5) — Portland Metro
- Median Age by Zip Code (ZCTA5) — Chicago Metro
- Median Age by Zip Code (ZCTA5) — Dallas Metro
- Median Age by Zip Code (ZCTA5) — Atlanta Metro