NOTE: Gray indicates insufficient data or a suppressed estimate.
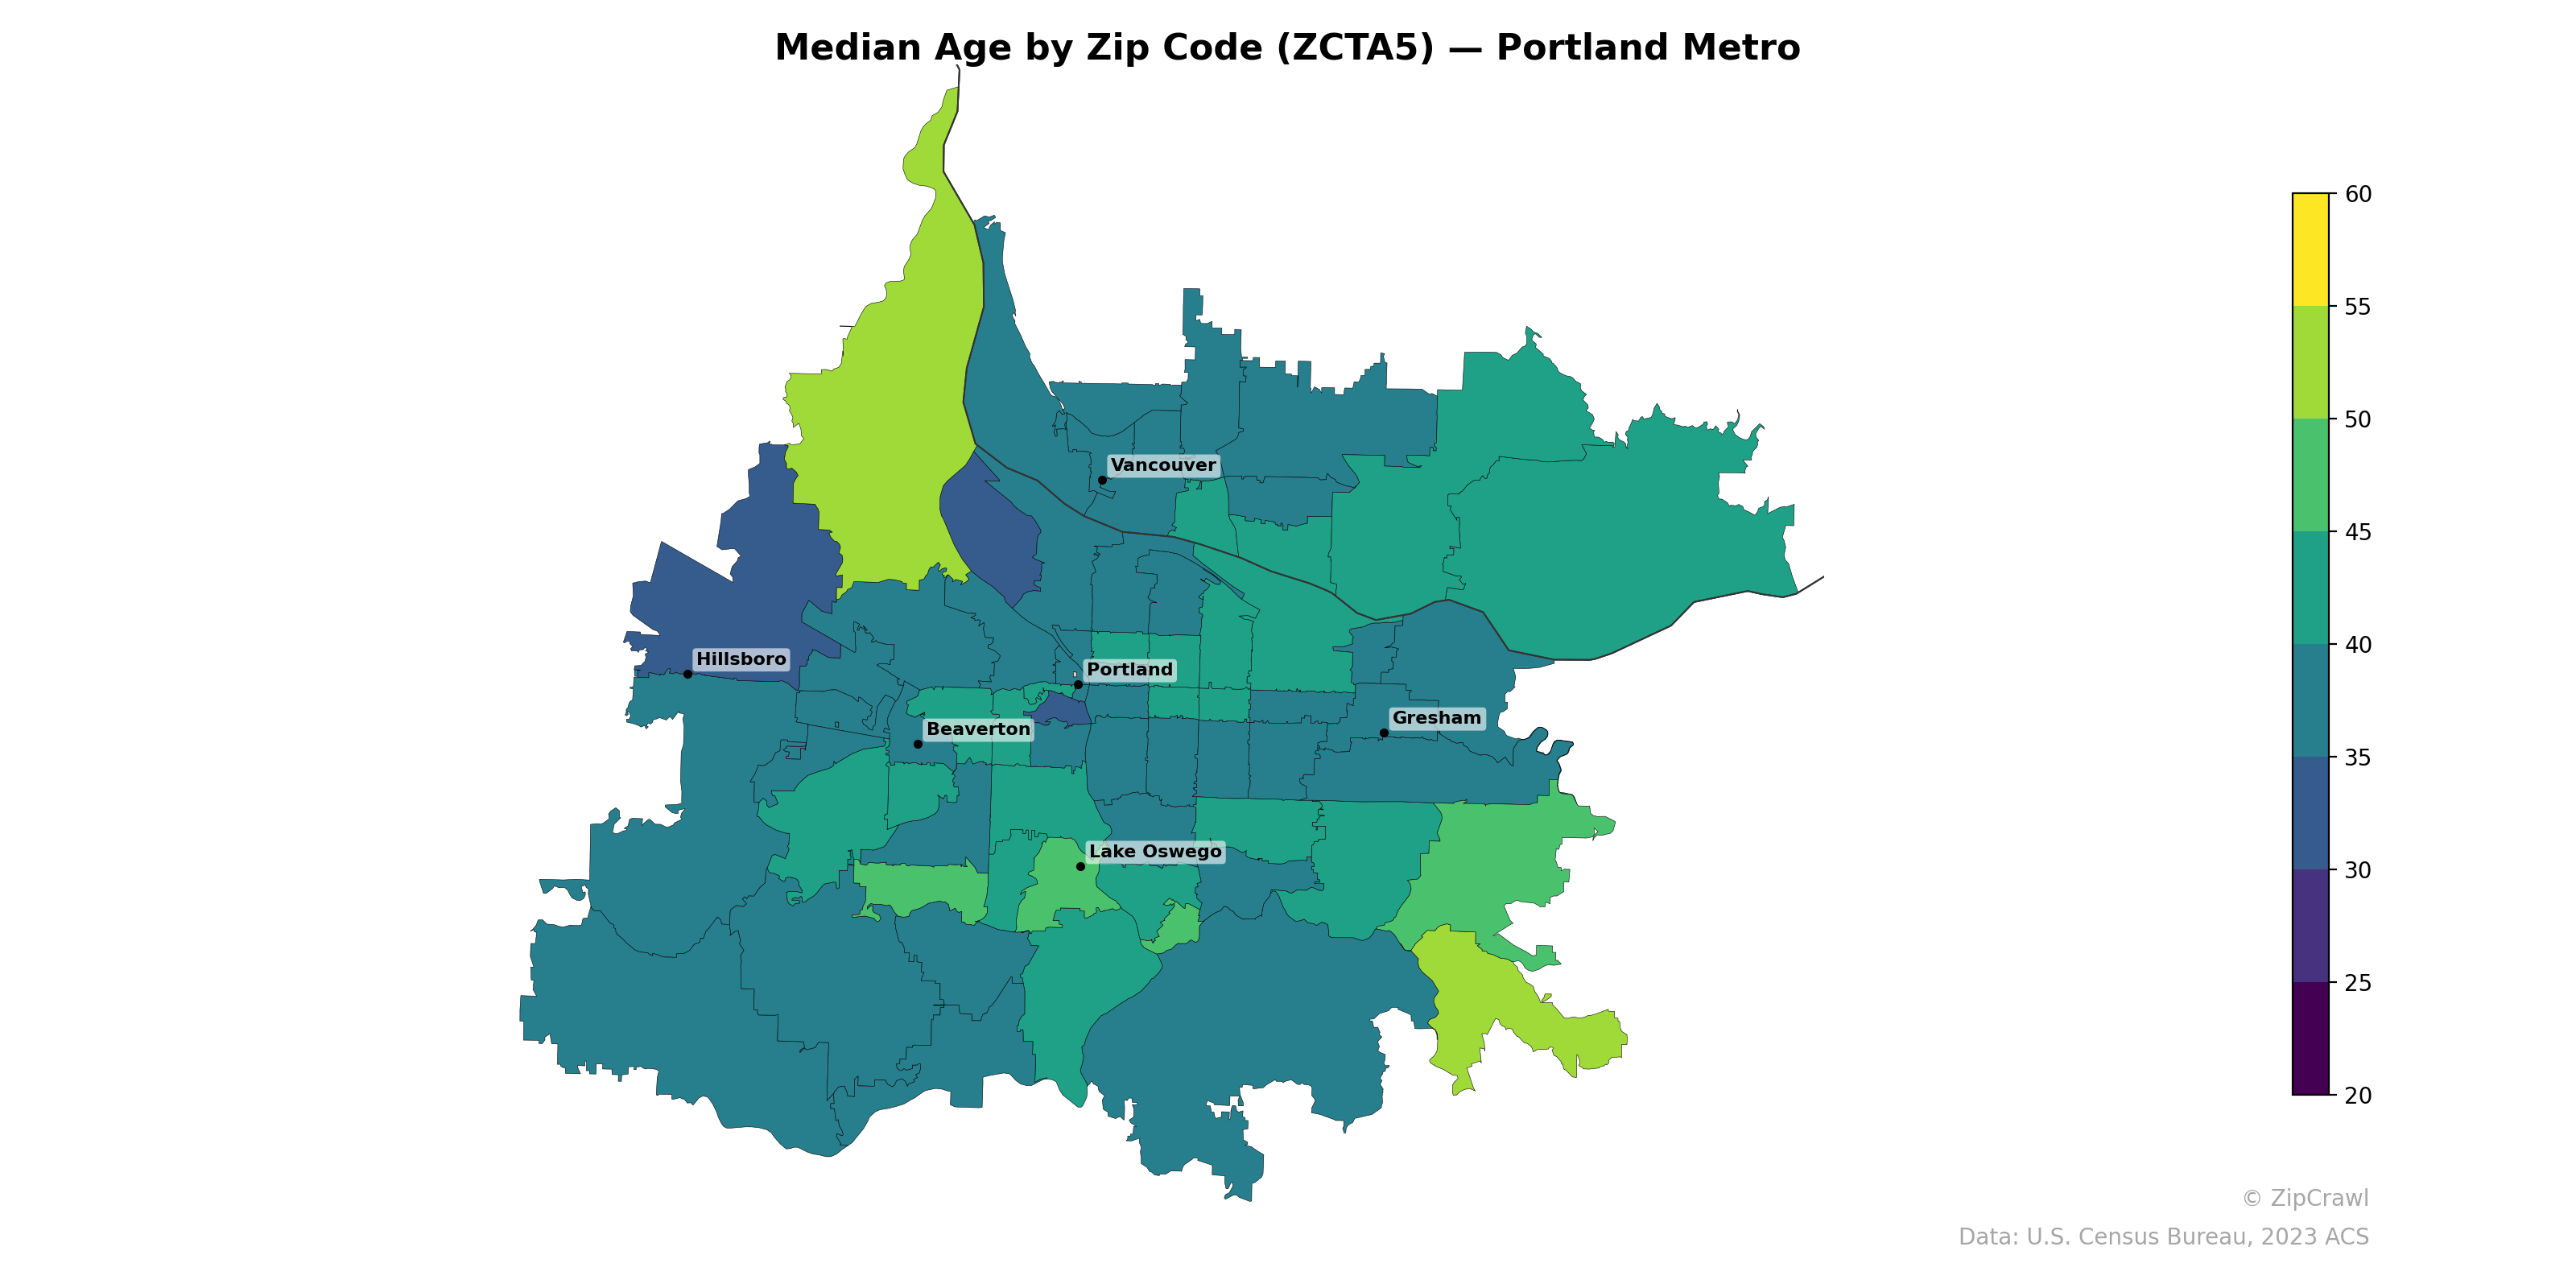
The Portland metro area exhibits a clear age gradient, with younger median ages concentrated in the urban core—particularly in inner Portland and parts of Hillsboro, where values dip into the low-to-mid 30s—while older populations cluster along the northern periphery near the Columbia River corridor and in the southern exurban fringe, where median ages reach into the mid-50s and above. A notable pocket of very low median age (around 20) appears in the southeastern corner of the metro, likely corresponding to a college campus or student-heavy community. The western suburbs, including Beaverton and Lake Oswego, generally fall in the 38–45 range, reflecting established family-oriented neighborhoods that bridge the younger urban core and the older rural edges.
Data: U.S. Census Bureau, 2023 ACS
Explore
- Population Non-Hispanic American Indian % by Zip Code (ZCTA5) — Texas
- % of Population on Food Stamps or SNAP (Last 12 Months), by Zip Code (ZCTA5) — Austin Metro
- Population Non-Hispanic Asian % by Zip Code (ZCTA5) — Austin Metro
- Household Median Income by Zip Code (ZCTA5) — Portland Metro
- Population Non-Hispanic American Indian % by Zip Code (ZCTA5) — Portland Metro
- U.S. Citizens (% of Population Over 18) by Zip Code (ZCTA5) — Portland Metro
- High School Graduate (% of Over 25) by Zip Code (ZCTA5) — Portland Metro
- Population Non-Hispanic Black % by Zip Code (ZCTA5) — Portland Metro
- Population Hispanic % by Zip Code (ZCTA5) — Portland Metro
- Population Non-Hispanic White % by Zip Code (ZCTA5) — Portland Metro
- High School Graduate (% of Over 25) by County
- Population Non-Hispanic White % by Zip Code (ZCTA5) — Texas
- U.S. Citizens (% of Population Over 18) by Zip Code (ZCTA5) — Texas
- % of Population on Food Stamps or SNAP (Last 12 Months), by Zip Code (ZCTA5) — Chicago Metro
- Population Non-Hispanic Black % by Zip Code (ZCTA5) — Texas
- Population Hispanic % by Zip Code (ZCTA5) — Texas
- High School Graduate (% of Over 25) by Zip Code (ZCTA5) — Texas
- Household Median Income by Zip Code (ZCTA5) — Texas
- Population Non-Hispanic Asian % by Zip Code (ZCTA5) — Chicago Metro
- Housing Median Monthly Rent ($), by Zip Code (ZCTA5) — Baltimore Metro
- Housing Owner-Occupied % of Units, by Zip Code (ZCTA5) — Baltimore Metro
- Housing % of Units Built Since 2010, by Zip Code (ZCTA5) — Baltimore Metro
- Household Median Income by Zip Code (ZCTA5) — Baltimore Metro
- Bachelor's Degree or Higher (% of Over 25) by Zip Code (ZCTA5) — Baltimore Metro
- % of Population on Food Stamps or SNAP (Last 12 Months), by Zip Code (ZCTA5) — Charlotte Metro
- High School Graduate (% of Over 25) by Zip Code (ZCTA5) — Baltimore Metro
- U.S. Citizens (% of Population Over 18) by Zip Code (ZCTA5) — Baltimore Metro
- % of Population without Health Insurance, by Zip Code (ZCTA5) — Baltimore Metro
- Housing Owner-Occupied Median Value ($), by Zip Code (ZCTA5) — Baltimore Metro
- % of Households with Broadband Internet, by Zip Code (ZCTA5) — Baltimore Metro
- Median Age by Zip Code (ZCTA5) — Atlanta Metro
- Median Age by Zip Code (ZCTA5) — Orlando Metro
- Median Age by Zip Code (ZCTA5) — Miami Metro
- Median Age by Zip Code (ZCTA5) — Phoenix Metro
- Median Age by Zip Code (ZCTA5) — Austin Metro
- Median Age by Zip Code (ZCTA5) — Boston Metro
- Median Age by Zip Code (ZCTA5) — Detroit Metro
- Median Age by Zip Code (ZCTA5) — Tampa Metro
- Median Age by Zip Code (ZCTA5) — Maryland
- Median Age by Zip Code (ZCTA5) — Denver Metro