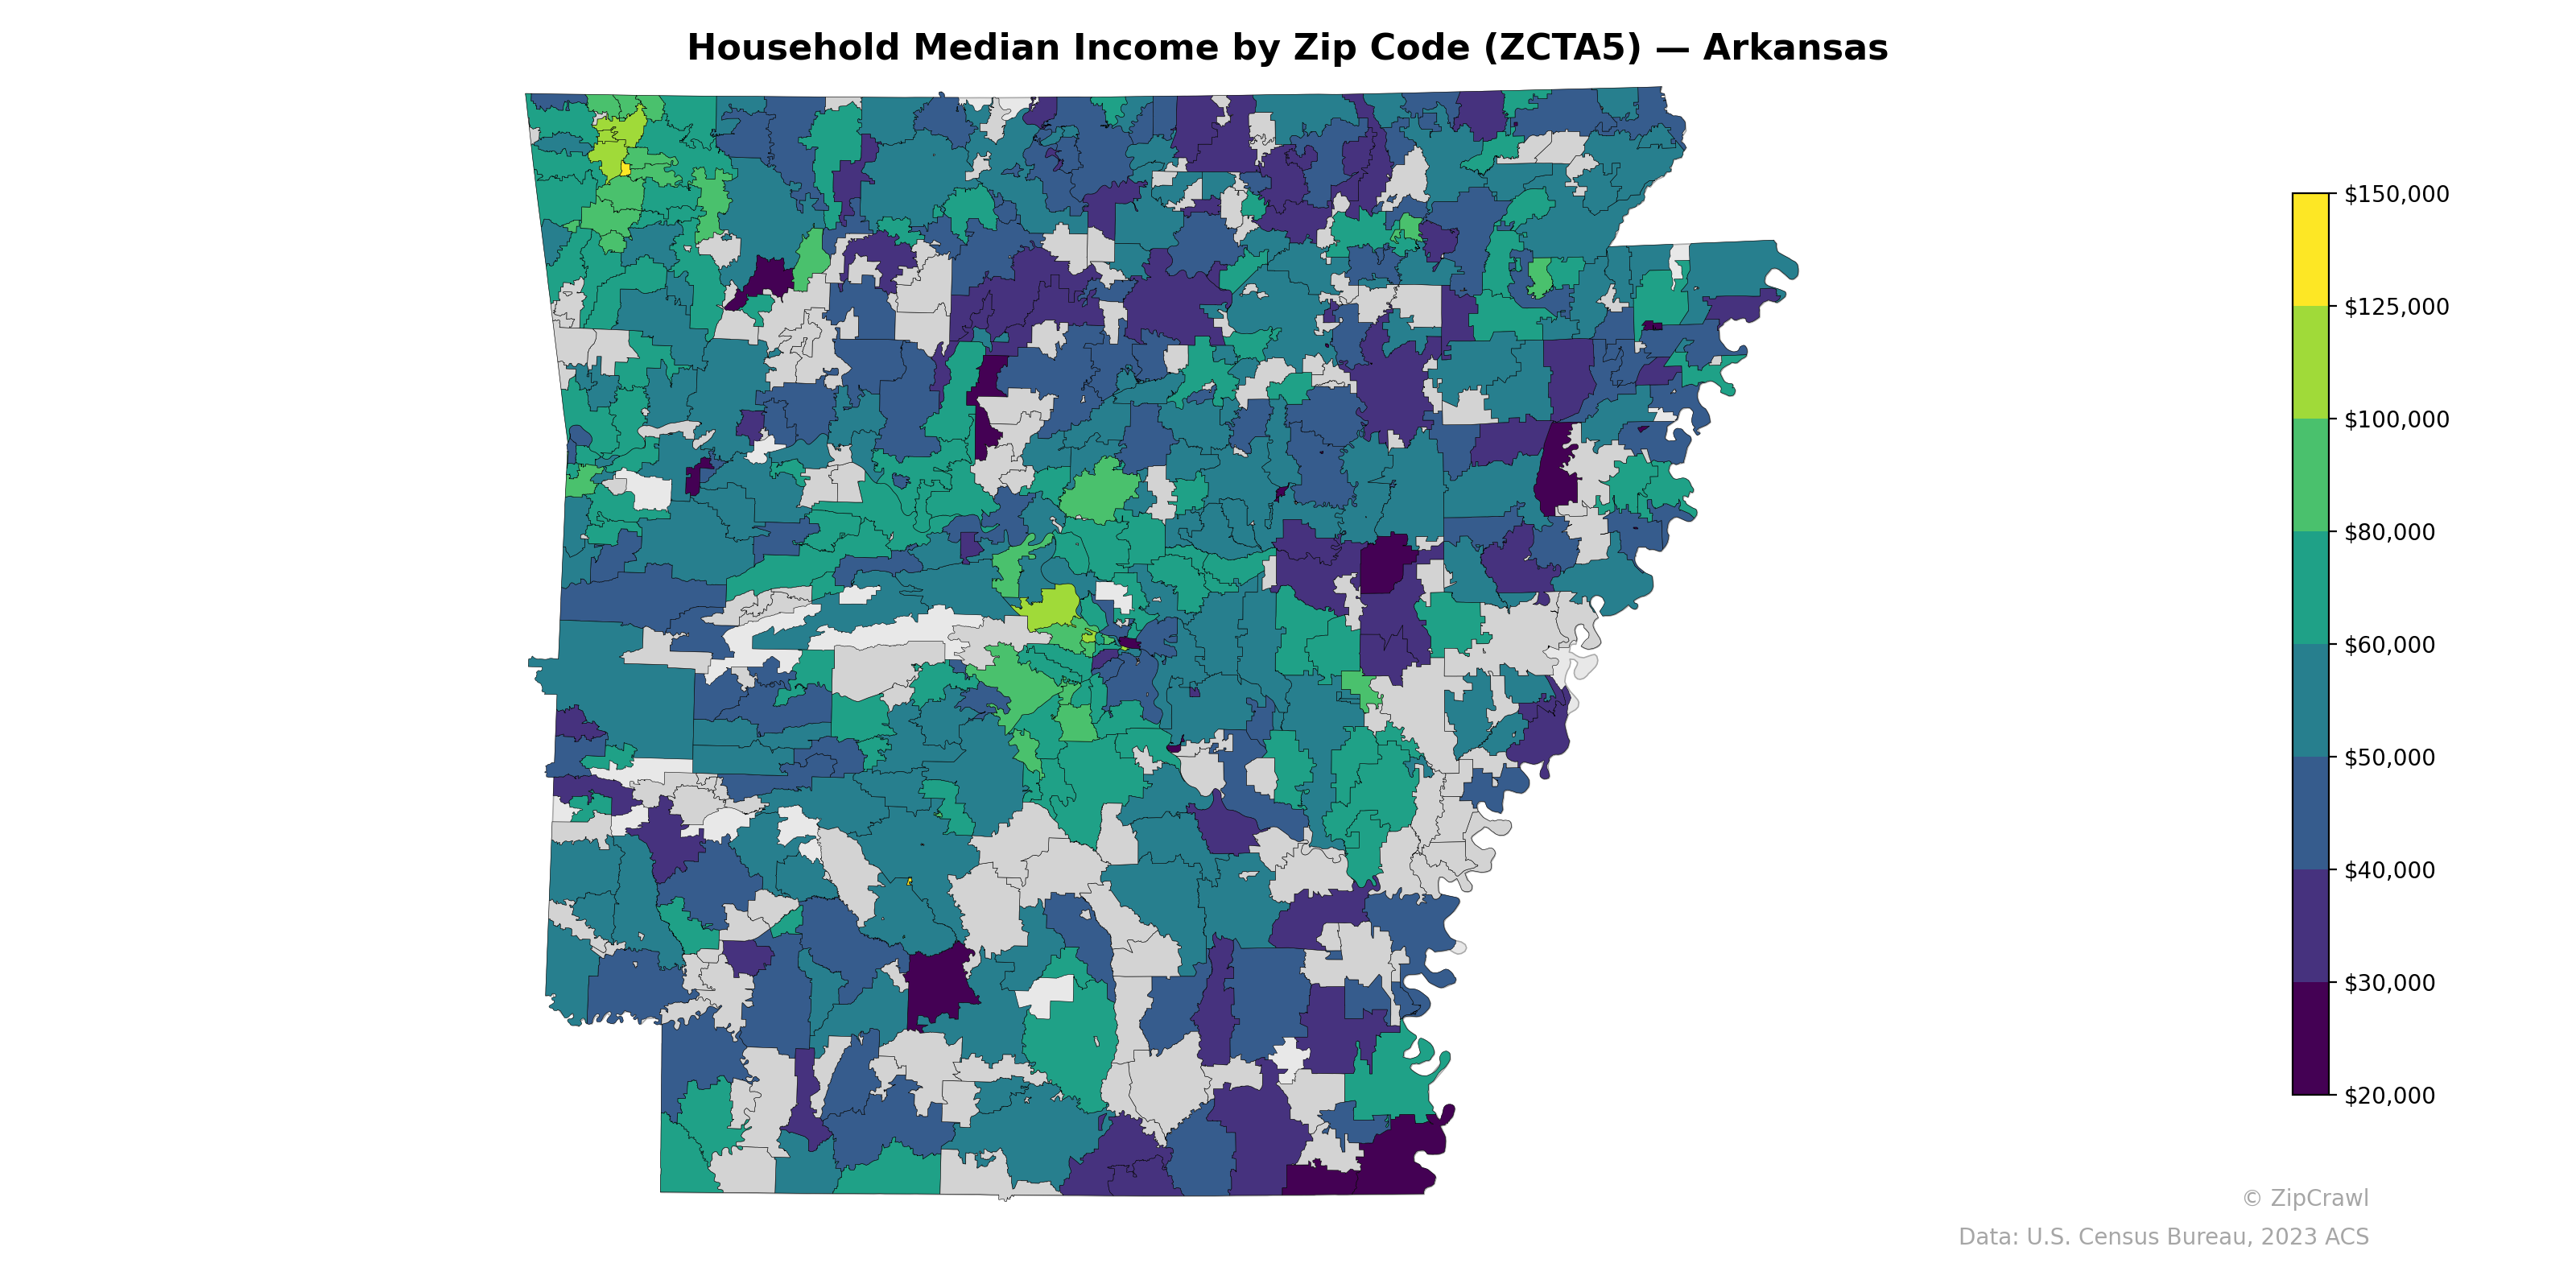
NOTE: Gray indicates insufficient data or a suppressed estimate.
The northwest corner of Arkansas, encompassing the Bentonville-Fayetteville-Rogers metropolitan area, displays the highest concentration of median household incomes, with several zip codes exceeding $100,000—likely driven by the economic influence of Walmart's headquarters and the University of Arkansas. A stark contrast exists in the Mississippi Delta region along the eastern border and parts of the south-central Ouachita Mountains, where numerous zip codes fall below $30,000, reflecting persistent rural poverty in those areas. The central corridor around Little Rock shows moderate-to-high incomes in suburban zip codes, particularly to the west, while the city core and surrounding rural areas trend noticeably lower.
Data: U.S. Census Bureau, 2023 ACS
Explore
- Population Non-Hispanic Black % by Zip Code (ZCTA5) — Florida
- Population Non-Hispanic Black % by Zip Code (ZCTA5) — Arkansas
- Married Couple (% of all Households) by Zip Code (ZCTA5) — Nevada
- Population Non-Hispanic Asian % by Zip Code (ZCTA5) — Nevada
- Population Non-Hispanic White % by Zip Code (ZCTA5) — Arkansas
- Median Age by Zip Code (ZCTA5) — Arkansas
- Population Hispanic % by Zip Code (ZCTA5) — Arkansas
- % of Population on Food Stamps or SNAP (Last 12 Months), by Zip Code (ZCTA5) — Nevada
- Housing Vacancy Rate by Zip Code (ZCTA5) — Nevada
- U.S. Citizens (% of Population Over 18) by Zip Code (ZCTA5) — Arkansas
- Housing Owner-Occupied Median Value ($), by County
- Housing Median Monthly Rent ($), by Zip Code (ZCTA5) — Illinois
- Housing Median Monthly Rent ($), by Zip Code (ZCTA5) — Houston Metro
- Population Hispanic % by Zip Code (ZCTA5) — Florida
- Population Non-Hispanic White % by Zip Code (ZCTA5) — Florida
- Population Non-Hispanic American Indian % by Zip Code (ZCTA5) — Florida
- % of Population on Food Stamps or SNAP (Last 12 Months), by Zip Code (ZCTA5) — California
- U.S. Citizens (% of Population Over 18) by Zip Code (ZCTA5) — Florida
- Population Non-Hispanic Asian % by Zip Code (ZCTA5) — California
- Median Age by Zip Code (ZCTA5) — Florida
- High School Graduate (% of Over 25) by Zip Code (ZCTA5) — Florida
- Housing Vacancy Rate by Zip Code (ZCTA5) — Connecticut
- Bachelor's Degree or Higher (% of Over 25) by Zip Code (ZCTA5) — Connecticut
- Population Non-Hispanic Asian % by Zip Code (ZCTA5) — Connecticut
- % of Households with Broadband Internet, by Zip Code (ZCTA5) — Connecticut
- Housing Median Monthly Rent ($), by Zip Code (ZCTA5) — Nevada
- Population Non-Hispanic American Indian % by Zip Code (ZCTA5) — Connecticut
- Median Age by Zip Code (ZCTA5) — Iowa
- High School Graduate (% of Over 25) by Zip Code (ZCTA5) — Connecticut
- Household Average Size by Zip Code (ZCTA5) — Connecticut
- Household Median Income by Zip Code (ZCTA5) — Kansas
- Household Median Income by Zip Code (ZCTA5) — Arizona
- Household Median Income by Zip Code (ZCTA5) — Texas
- Household Median Income by Zip Code (ZCTA5) — Indiana
- Household Median Income by Zip Code (ZCTA5) — Iowa
- Household Median Income by Zip Code (ZCTA5) — Alaska
- Household Median Income by Zip Code (ZCTA5) — Ohio
- Household Median Income by Zip Code (ZCTA5) — Idaho
- Household Median Income by Zip Code (ZCTA5) — Maine
- Household Median Income by Zip Code (ZCTA5) — Utah