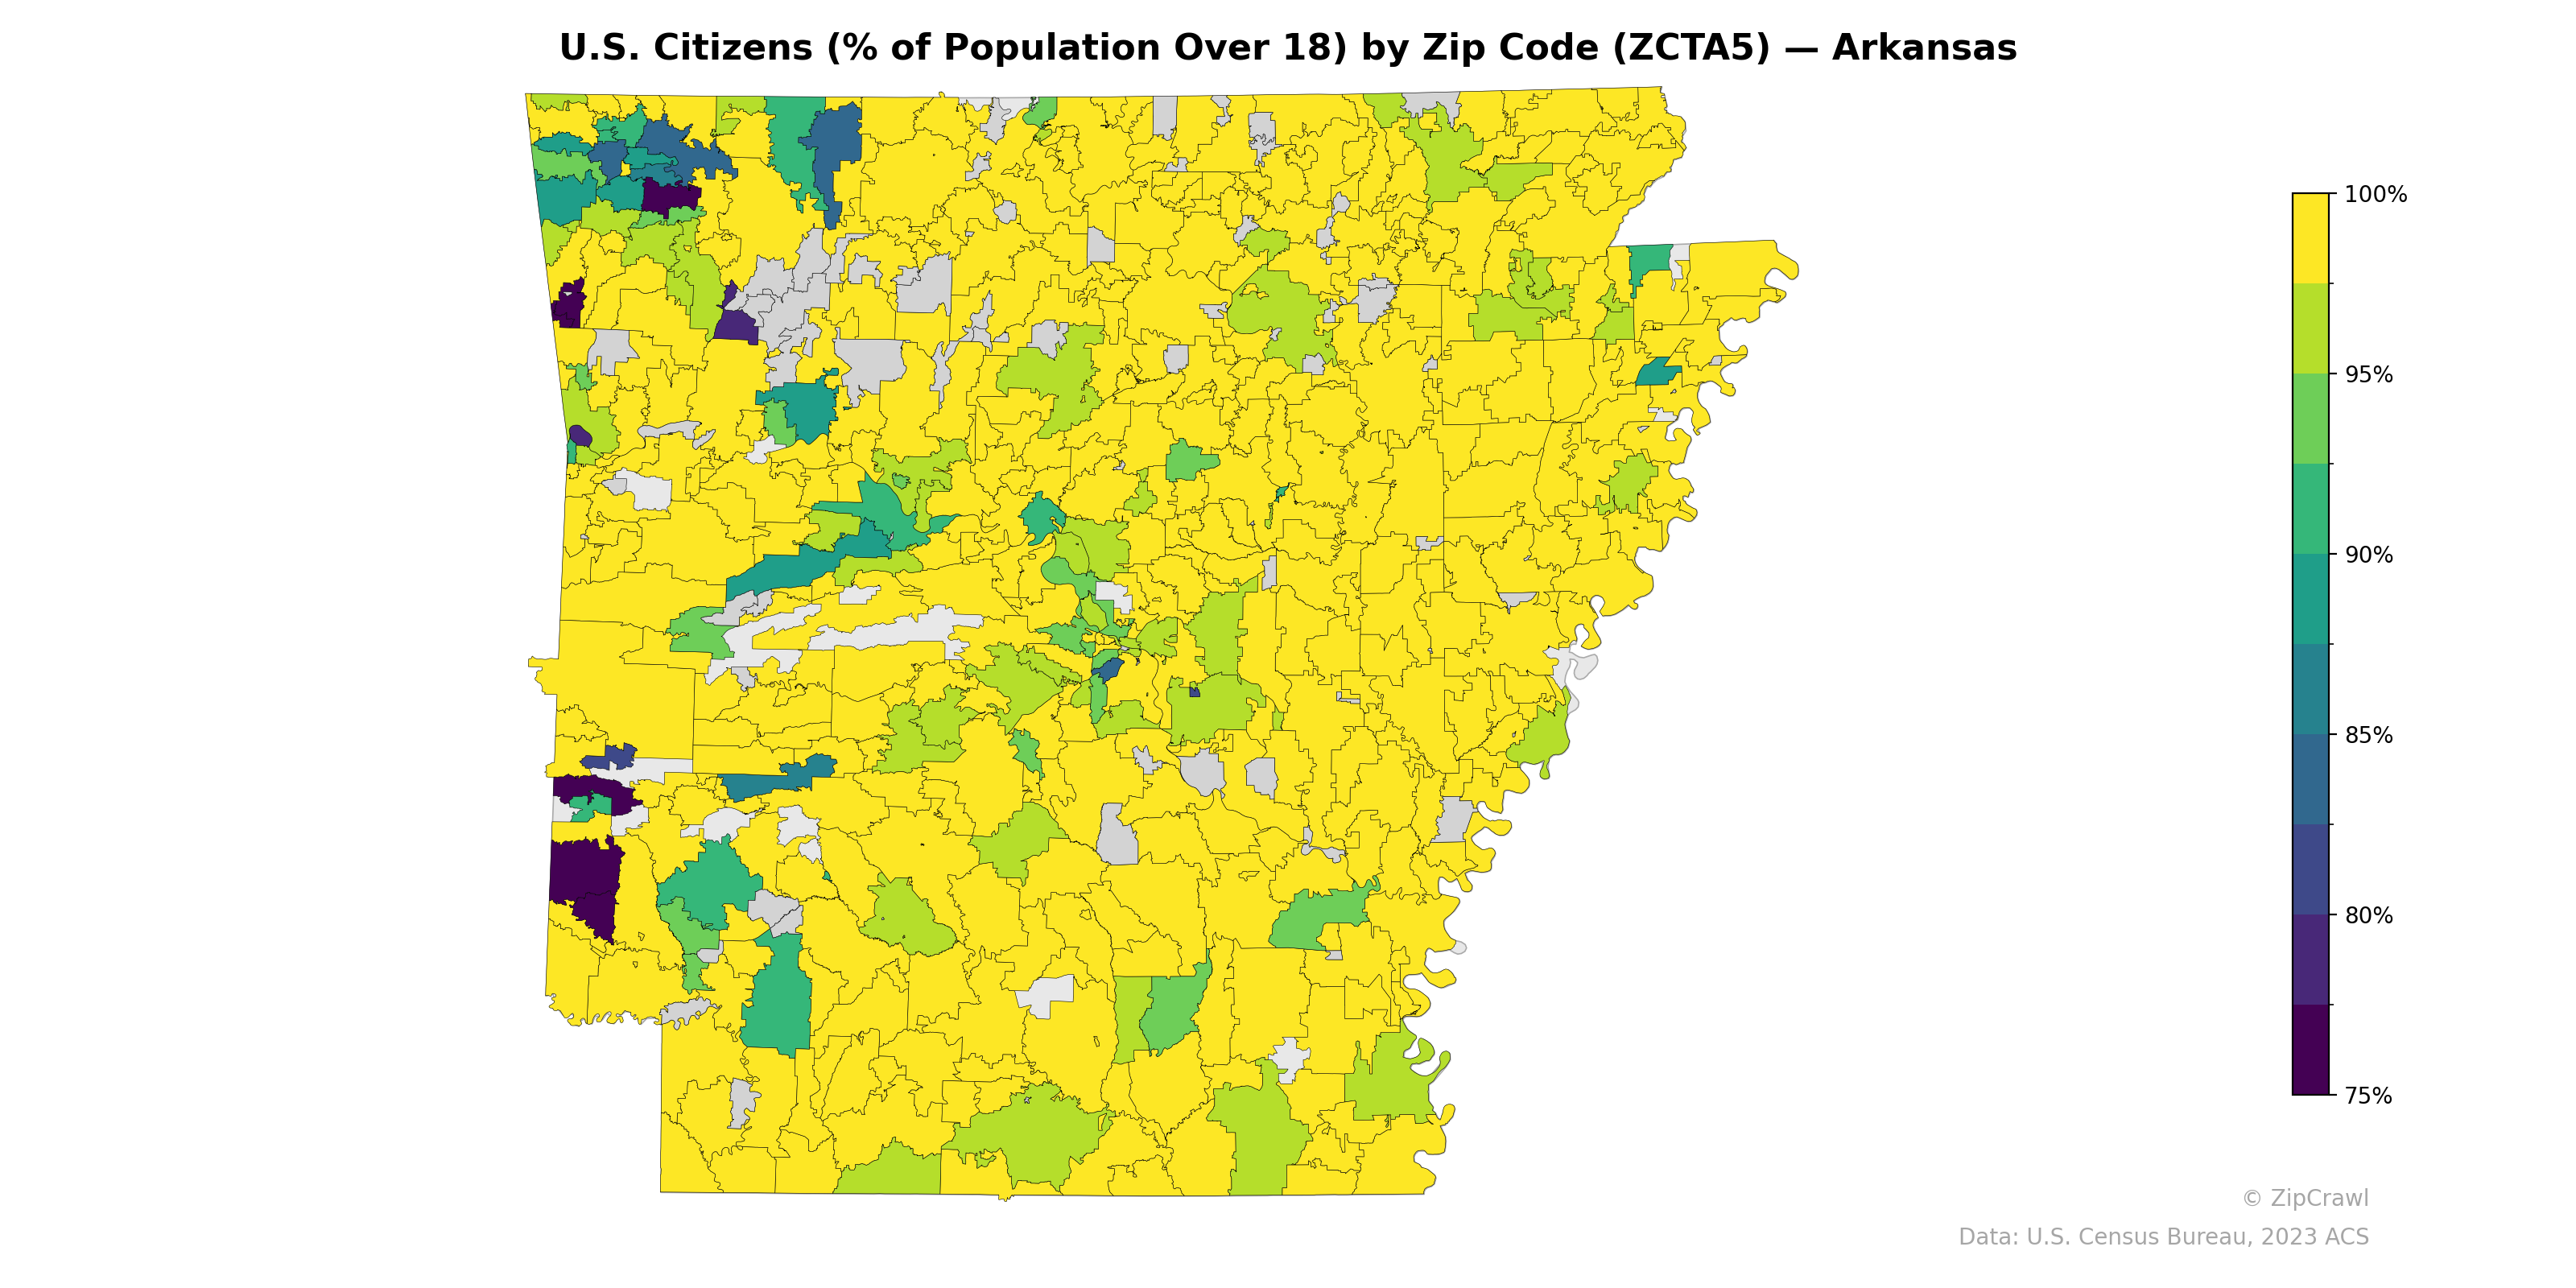
NOTE: Gray indicates insufficient data or a suppressed estimate.
The vast majority of Arkansas zip codes report U.S. citizenship rates above 95% among the adult population, with near-universal citizenship across the eastern Delta region and much of the rural interior. Notable concentrations of lower citizenship rates (80–90%) cluster in the northwest corner of the state—corresponding to the Springdale-Rogers metropolitan area, a hub for immigrant labor in the poultry industry—and in scattered zip codes across the south-central and southwestern regions. A few zip codes in the northwest and southwest dip below 75%, representing the starkest contrast against the predominantly yellow (near-100%) landscape that characterizes most of the state.
Data: U.S. Census Bureau, 2023 ACS
Explore
- Population Non-Hispanic Black % by Zip Code (ZCTA5) — Florida
- % of Population on Food Stamps or SNAP (Last 12 Months), by Zip Code (ZCTA5) — Nevada
- Married Couple (% of all Households) by Zip Code (ZCTA5) — Nevada
- Housing Vacancy Rate by Zip Code (ZCTA5) — Nevada
- Population Non-Hispanic White % by Zip Code (ZCTA5) — Arkansas
- Population Non-Hispanic Black % by Zip Code (ZCTA5) — Arkansas
- Median Age by Zip Code (ZCTA5) — Arkansas
- Household Median Income by Zip Code (ZCTA5) — Arkansas
- Population Hispanic % by Zip Code (ZCTA5) — Arkansas
- Population Non-Hispanic Asian % by Zip Code (ZCTA5) — Nevada
- Housing Owner-Occupied Median Value ($), by County
- Housing Owner-Occupied Median Value ($), by Zip Code (ZCTA5) — Illinois
- Housing Owner-Occupied Median Value ($), by Zip Code (ZCTA5) — Houston Metro
- Population Hispanic % by Zip Code (ZCTA5) — Florida
- Population Non-Hispanic White % by Zip Code (ZCTA5) — Florida
- Population Non-Hispanic American Indian % by Zip Code (ZCTA5) — Florida
- Population Non-Hispanic Asian % by Zip Code (ZCTA5) — California
- % of Population on Food Stamps or SNAP (Last 12 Months), by Zip Code (ZCTA5) — California
- Household Median Income by Zip Code (ZCTA5) — Florida
- Median Age by Zip Code (ZCTA5) — Florida
- High School Graduate (% of Over 25) by Zip Code (ZCTA5) — Florida
- Household Average Size by Zip Code (ZCTA5) — Connecticut
- High School Graduate (% of Over 25) by Zip Code (ZCTA5) — Connecticut
- Married Couple (% of all Households) by Zip Code (ZCTA5) — Connecticut
- Household Median Income by Zip Code (ZCTA5) — Iowa
- Housing Median Monthly Rent ($), by Zip Code (ZCTA5) — Nevada
- Median Age by Zip Code (ZCTA5) — Iowa
- Population Hispanic % by Zip Code (ZCTA5) — Mississippi
- Population Non-Hispanic American Indian % by Zip Code (ZCTA5) — Connecticut
- Bachelor's Degree or Higher (% of Over 25) by Zip Code (ZCTA5) — Connecticut
- U.S. Citizens (% of Population Over 18) by Zip Code (ZCTA5) — Kansas
- U.S. Citizens (% of Population Over 18) by Zip Code (ZCTA5) — Arizona
- U.S. Citizens (% of Population Over 18) by Zip Code (ZCTA5) — Texas
- U.S. Citizens (% of Population Over 18) by Zip Code (ZCTA5) — Ohio
- U.S. Citizens (% of Population Over 18) by Zip Code (ZCTA5) — Utah
- U.S. Citizens (% of Population Over 18) by Zip Code (ZCTA5) — Alaska
- U.S. Citizens (% of Population Over 18) by Zip Code (ZCTA5) — Oregon
- U.S. Citizens (% of Population Over 18) by Zip Code (ZCTA5) — Iowa
- U.S. Citizens (% of Population Over 18) by Zip Code (ZCTA5) — Alabama
- U.S. Citizens (% of Population Over 18) by Zip Code (ZCTA5) — Idaho