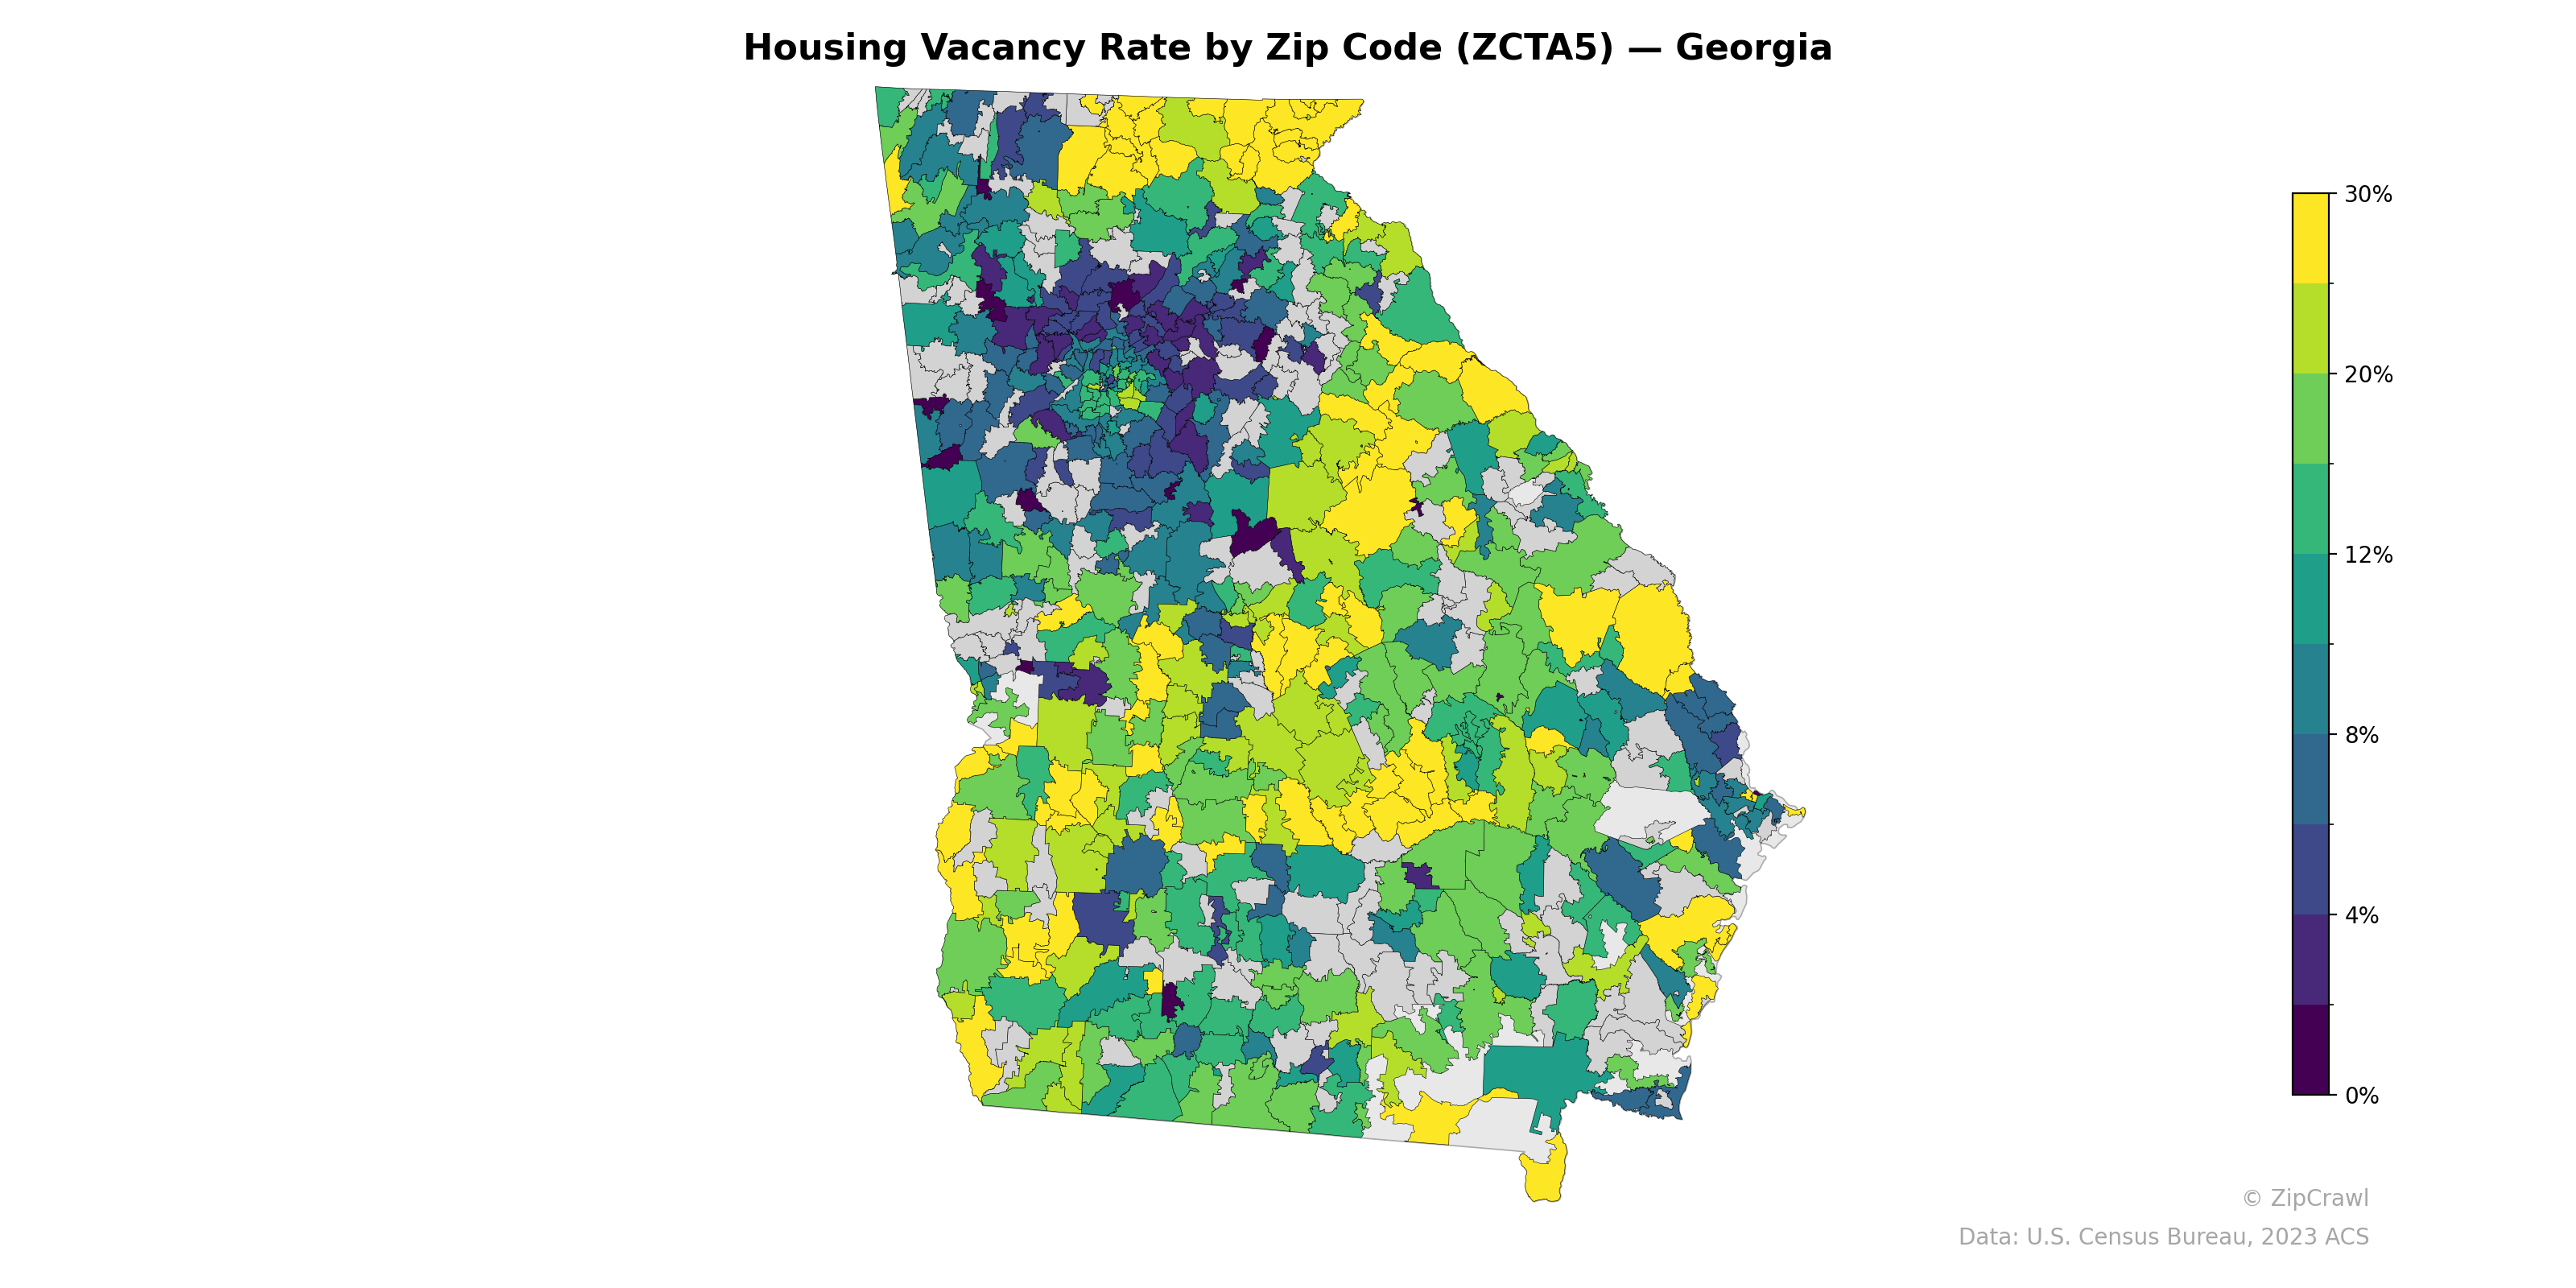
NOTE: Gray indicates insufficient data or a suppressed estimate.
Housing vacancy rates across Georgia exhibit a pronounced urban-rural divide, with the lowest rates (under 4%) concentrated in the Atlanta metropolitan area's suburban zip codes, particularly in the northern arc spanning from Cobb through Gwinnett counties, reflecting sustained housing demand in those high-growth corridors. Southern and southwestern Georgia display notably elevated vacancy rates, frequently exceeding 20%, with clusters of yellow-shaded zip codes suggesting persistent population decline and housing surplus in rural communities. The coastal region near Savannah and the barrier islands presents a mixed pattern, with some zip codes showing very low vacancy alongside adjacent areas with moderate-to-high rates, likely reflecting the contrast between seasonal/vacation housing stock and year-round residential markets.
Data: U.S. Census Bureau, 2023 ACS
Explore
- Median Age by Zip Code (ZCTA5) — New York Metro
- Housing Owner-Occupied Median Value ($), by Zip Code (ZCTA5) — Georgia
- % of Households with Broadband Internet, by Zip Code (ZCTA5) — Georgia
- Housing % of Units Built Since 2010, by Zip Code (ZCTA5) — Georgia
- Household Average Size by Zip Code (ZCTA5) — Georgia
- Housing Owner-Occupied % of Units, by Zip Code (ZCTA5) — Georgia
- Housing Median Monthly Rent ($), by Zip Code (ZCTA5) — Georgia
- Bachelor's Degree or Higher (% of Over 25) by Zip Code (ZCTA5) — Georgia
- Married Couple (% of all Households) by Zip Code (ZCTA5) — Georgia
- % of Population without Health Insurance, by Zip Code (ZCTA5) — Georgia
- Population Non-Hispanic Black % by Zip Code (ZCTA5) — Iowa
- Median Age by County
- U.S. Citizens (% of Population Over 18) by Zip Code (ZCTA5) — New York Metro
- Population Hispanic % by Zip Code (ZCTA5) — New York Metro
- Population Non-Hispanic White % by Zip Code (ZCTA5) — New York Metro
- High School Graduate (% of Over 25) by Zip Code (ZCTA5) — New York Metro
- % of Population on Food Stamps or SNAP (Last 12 Months), by County
- Population Non-Hispanic Black % by Zip Code (ZCTA5) — New York Metro
- Bachelor's Degree or Higher (% of Over 25) by Zip Code (ZCTA5) — New York Metro
- Household Median Income by Zip Code (ZCTA5) — New York Metro
- Population Non-Hispanic American Indian % by Zip Code (ZCTA5) — New York Metro
- Population Non-Hispanic Asian % by Zip Code (ZCTA5) — New York Metro
- % of Population without Health Insurance, by Zip Code (ZCTA5) — Ohio
- Bachelor's Degree or Higher (% of Over 25) by Zip Code (ZCTA5) — Ohio
- Housing Owner-Occupied % of Units, by Zip Code (ZCTA5) — Ohio
- Population Non-Hispanic White % by Zip Code (ZCTA5) — Ohio
- Population Non-Hispanic American Indian % by Zip Code (ZCTA5) — Ohio
- High School Graduate (% of Over 25) by Zip Code (ZCTA5) — Ohio
- % of Households with Broadband Internet, by Zip Code (ZCTA5) — Ohio
- Median Age by Zip Code (ZCTA5) — Ohio
- Housing Vacancy Rate by Zip Code (ZCTA5) — Virginia
- Housing Vacancy Rate by Zip Code (ZCTA5) — Iowa
- Housing Vacancy Rate by Zip Code (ZCTA5) — Ohio
- Housing Vacancy Rate by Zip Code (ZCTA5) — Utah
- Housing Vacancy Rate by Zip Code (ZCTA5) — Maine
- Housing Vacancy Rate by Zip Code (ZCTA5) — Wyoming
- Housing Vacancy Rate by Zip Code (ZCTA5) — Idaho
- Housing Vacancy Rate by Zip Code (ZCTA5) — Texas
- Housing Vacancy Rate by Zip Code (ZCTA5) — Hawaii
- Housing Vacancy Rate by Zip Code (ZCTA5) — Colorado