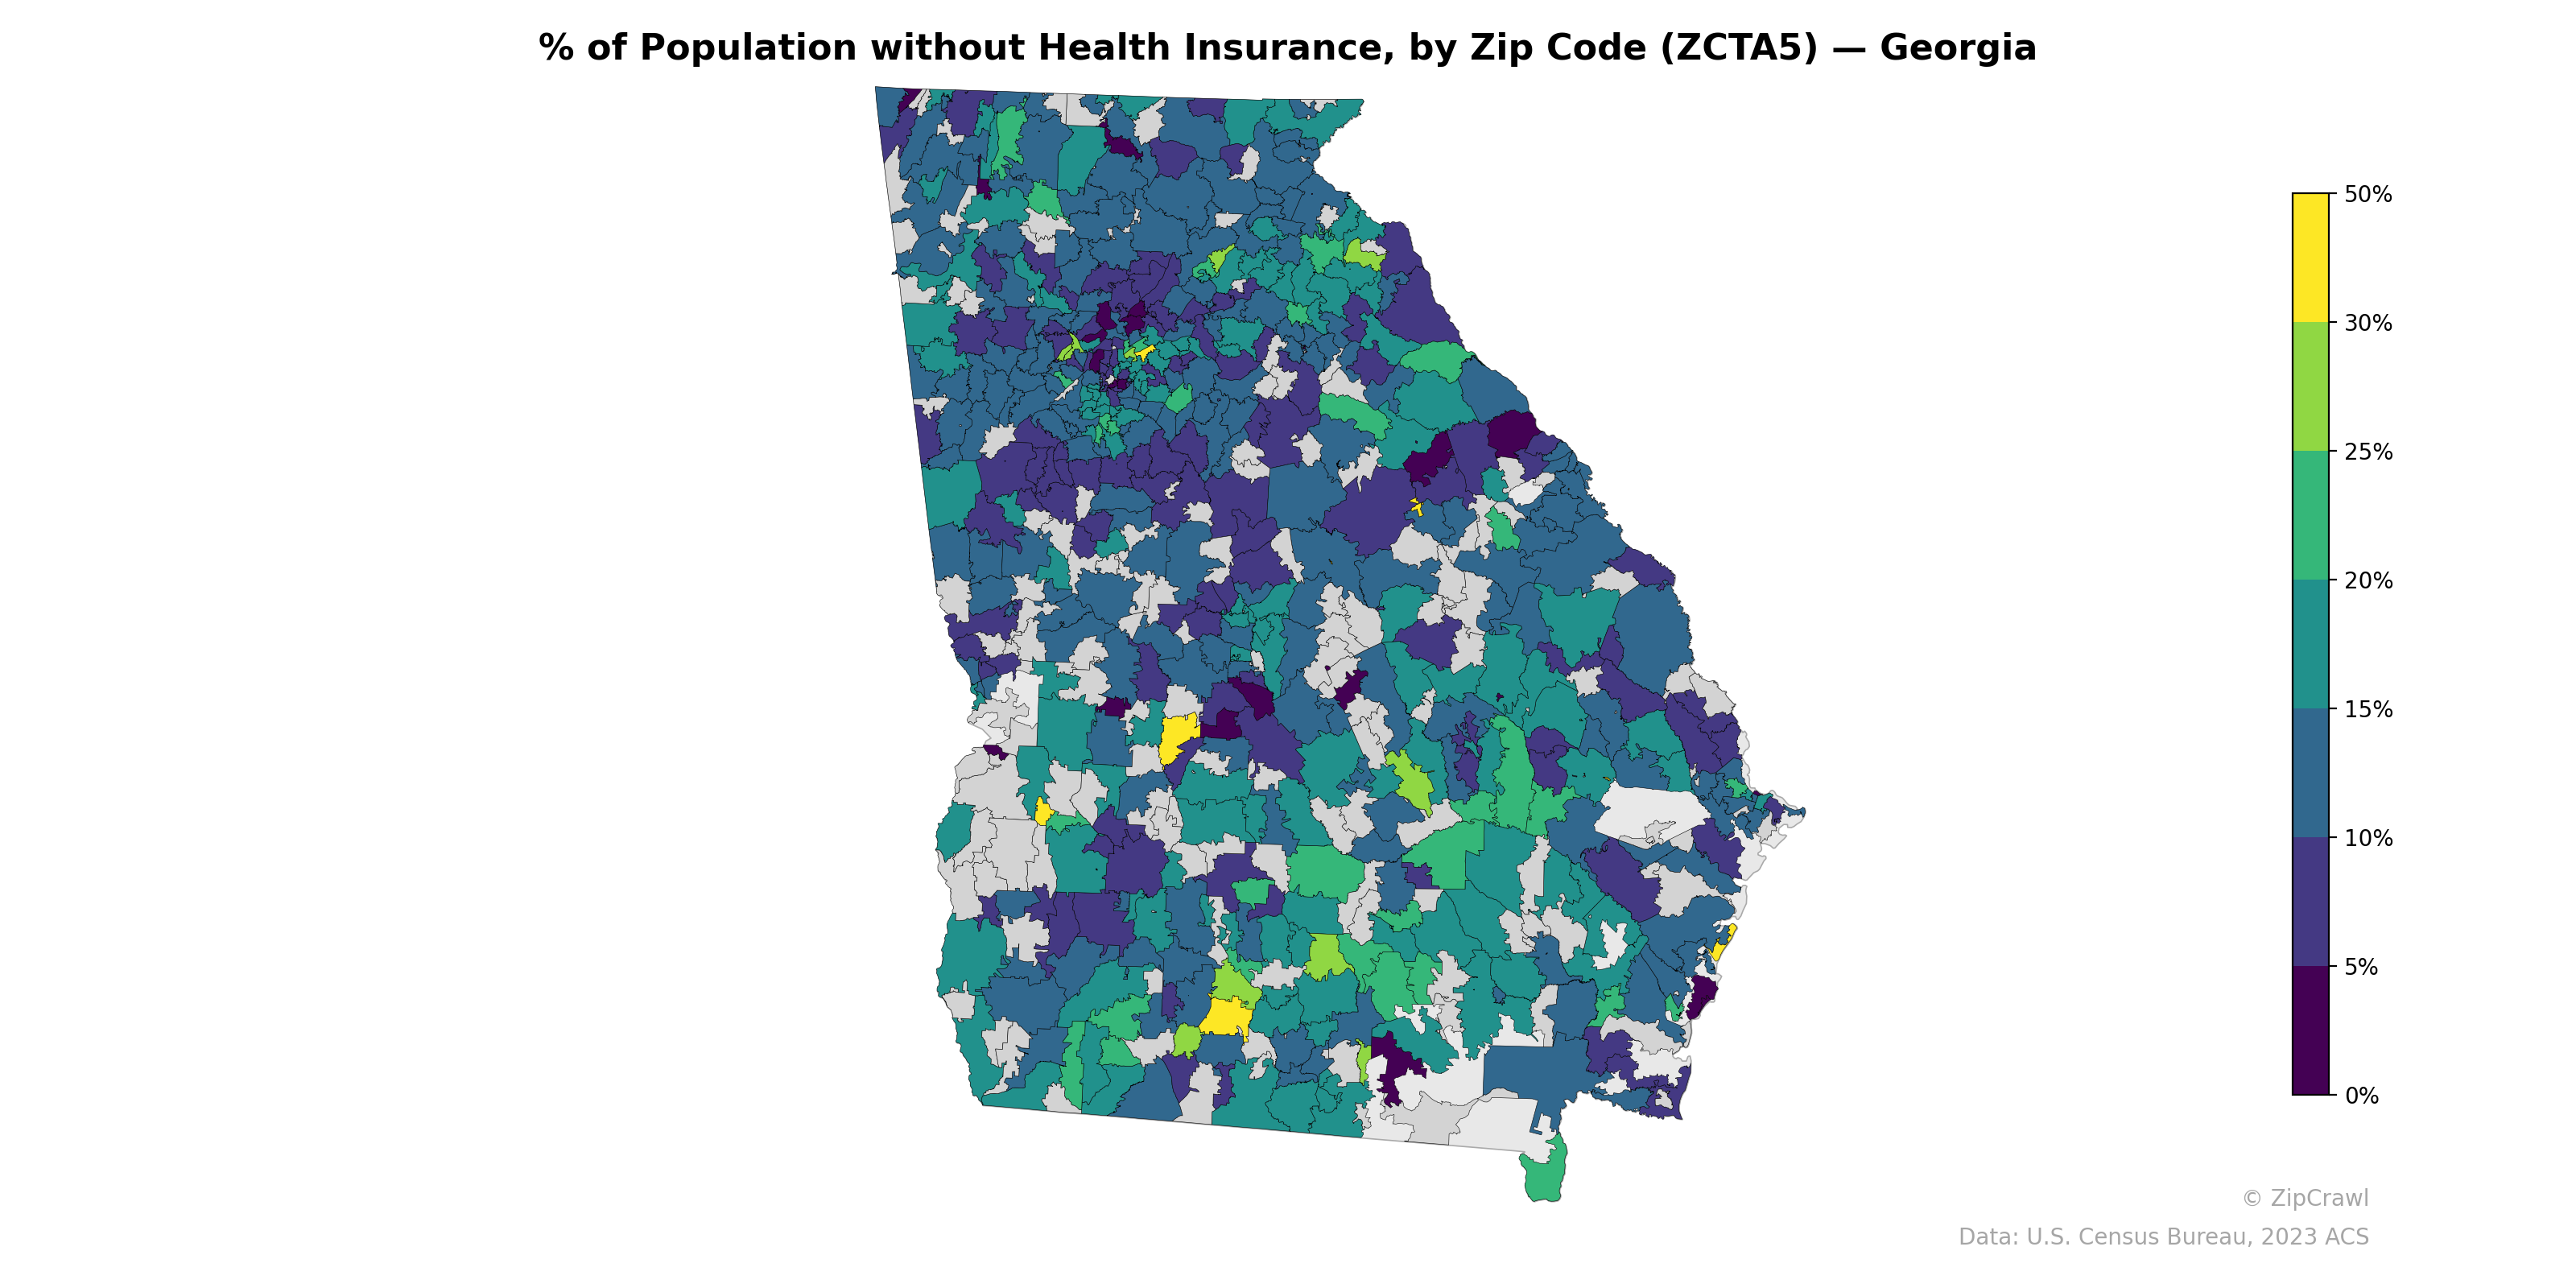
NOTE: Gray indicates insufficient data or a suppressed estimate.
Uninsured rates across Georgia's zip codes exhibit a pronounced urban-rural and regional divide, with the lowest rates (under 5%) concentrated in suburban Atlanta zip codes and select coastal areas, while much of south-central and southwest Georgia displays elevated uninsured rates frequently exceeding 20–25%. Several zip codes in the southern agricultural belt and along the central corridor approaching Valdosta and Tifton stand out with rates approaching 30% or higher, suggesting persistent gaps in coverage access in economically disadvantaged rural communities. The Atlanta metropolitan core and its northern suburbs form a clearly defined low-uninsurance cluster, contrasting sharply with scattered high-rate pockets in both rural middle Georgia and parts of the northeastern mountains.
Data: U.S. Census Bureau, 2023 ACS
Explore
- Median Age by Zip Code (ZCTA5) — New York Metro
- Housing Vacancy Rate by Zip Code (ZCTA5) — Georgia
- Housing Owner-Occupied % of Units, by Zip Code (ZCTA5) — Georgia
- % of Households with Broadband Internet, by Zip Code (ZCTA5) — Georgia
- Married Couple (% of all Households) by Zip Code (ZCTA5) — Georgia
- Household Average Size by Zip Code (ZCTA5) — Georgia
- Housing Median Monthly Rent ($), by Zip Code (ZCTA5) — Georgia
- Bachelor's Degree or Higher (% of Over 25) by Zip Code (ZCTA5) — Georgia
- Housing % of Units Built Since 2010, by Zip Code (ZCTA5) — Georgia
- Housing Owner-Occupied Median Value ($), by Zip Code (ZCTA5) — Georgia
- Population Non-Hispanic Asian % by Zip Code (ZCTA5) — Utah
- Median Age by County
- U.S. Citizens (% of Population Over 18) by Zip Code (ZCTA5) — New York Metro
- Population Hispanic % by Zip Code (ZCTA5) — New York Metro
- Population Non-Hispanic White % by Zip Code (ZCTA5) — New York Metro
- % of Population on Food Stamps or SNAP (Last 12 Months), by County
- Population Non-Hispanic Black % by Zip Code (ZCTA5) — New York Metro
- Population Non-Hispanic American Indian % by Zip Code (ZCTA5) — New York Metro
- Bachelor's Degree or Higher (% of Over 25) by Zip Code (ZCTA5) — New York Metro
- Household Median Income by Zip Code (ZCTA5) — New York Metro
- High School Graduate (% of Over 25) by Zip Code (ZCTA5) — New York Metro
- Housing Owner-Occupied Median Value ($), by Zip Code (ZCTA5) — Ohio
- % of Households with Broadband Internet, by Zip Code (ZCTA5) — Ohio
- Housing Median Monthly Rent ($), by Zip Code (ZCTA5) — Ohio
- Population Hispanic % by Zip Code (ZCTA5) — Ohio
- Population Non-Hispanic White % by Zip Code (ZCTA5) — Ohio
- High School Graduate (% of Over 25) by Zip Code (ZCTA5) — Ohio
- Bachelor's Degree or Higher (% of Over 25) by Zip Code (ZCTA5) — Ohio
- Housing Owner-Occupied % of Units, by Zip Code (ZCTA5) — Ohio
- Population Non-Hispanic Black % by Zip Code (ZCTA5) — Ohio
- % of Population without Health Insurance, by Zip Code (ZCTA5) — Iowa
- % of Population without Health Insurance, by Zip Code (ZCTA5) — Ohio
- % of Population without Health Insurance, by Zip Code (ZCTA5) — Virginia
- % of Population without Health Insurance, by Zip Code (ZCTA5) — Utah
- % of Population without Health Insurance, by Zip Code (ZCTA5) — Idaho
- % of Population without Health Insurance, by Zip Code (ZCTA5) — Oregon
- % of Population without Health Insurance, by Zip Code (ZCTA5) — Indiana
- % of Population without Health Insurance, by Zip Code (ZCTA5) — Texas
- % of Population without Health Insurance, by Zip Code (ZCTA5) — Hawaii
- % of Population without Health Insurance, by Zip Code (ZCTA5) — Maine