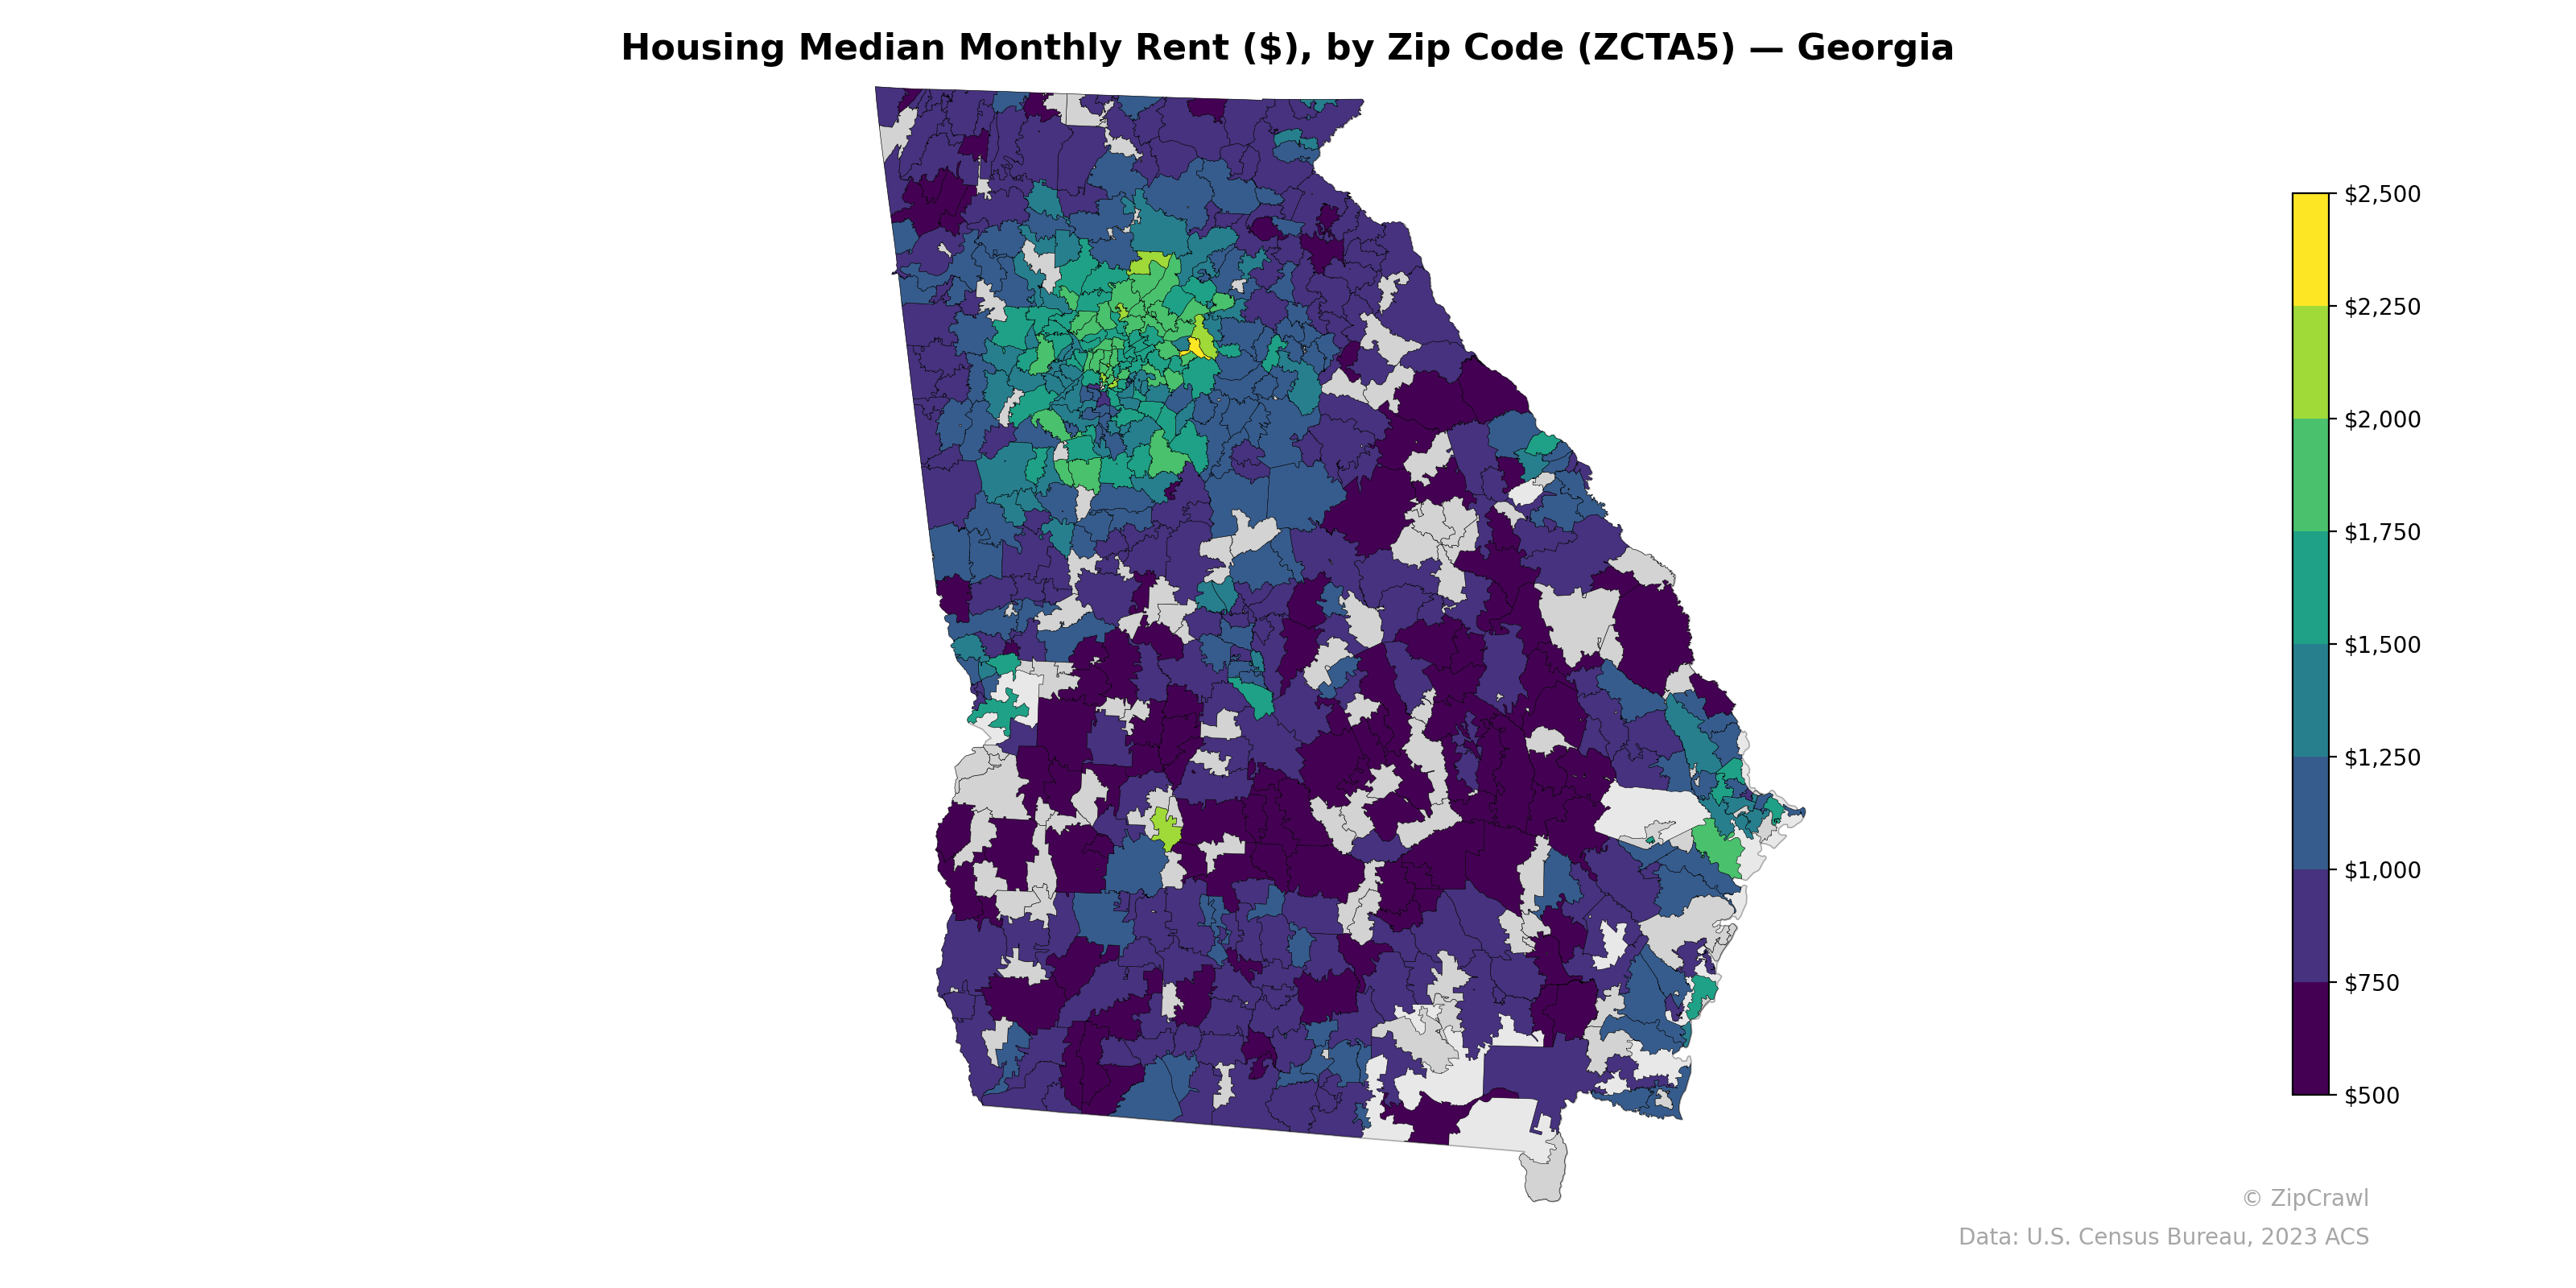
NOTE: Gray indicates insufficient data or a suppressed estimate.
Median monthly rents in Georgia concentrate most heavily in the Atlanta metropolitan area, where northern suburban zip codes in counties like Forsyth, Cherokee, and north Fulton reach $1,750–$2,500+, while zip codes in south and southwest Atlanta and surrounding rural areas fall well below $1,000. A stark urban-rural divide is evident, with the southern half of the state dominated by deep purple tones indicating rents largely in the $500–$750 range, punctuated only by isolated pockets of moderate rent near regional centers like Macon, Augusta, and the coastal Savannah/Brunswick corridor. The few yellow-highlighted zip codes—appearing near Alpharetta/Johns Creek north of Atlanta and one anomalous pocket in the middle-south region—represent peak rent outliers exceeding $2,250, underscoring extreme intrastate housing cost disparity.
Data: U.S. Census Bureau, 2023 ACS
Explore
- Median Age by Zip Code (ZCTA5) — New York Metro
- Housing Owner-Occupied Median Value ($), by Zip Code (ZCTA5) — Georgia
- % of Households with Broadband Internet, by Zip Code (ZCTA5) — Georgia
- Housing % of Units Built Since 2010, by Zip Code (ZCTA5) — Georgia
- Married Couple (% of all Households) by Zip Code (ZCTA5) — Georgia
- Housing Owner-Occupied % of Units, by Zip Code (ZCTA5) — Georgia
- Household Average Size by Zip Code (ZCTA5) — Georgia
- Bachelor's Degree or Higher (% of Over 25) by Zip Code (ZCTA5) — Georgia
- Housing Vacancy Rate by Zip Code (ZCTA5) — Georgia
- % of Population without Health Insurance, by Zip Code (ZCTA5) — Georgia
- Household Median Income by Zip Code (ZCTA5) — Iowa
- Median Age by County
- U.S. Citizens (% of Population Over 18) by Zip Code (ZCTA5) — New York Metro
- Population Non-Hispanic White % by Zip Code (ZCTA5) — New York Metro
- Housing % of Units Built Since 2010, by Zip Code (ZCTA5) — New York Metro
- High School Graduate (% of Over 25) by Zip Code (ZCTA5) — New York Metro
- % of Population on Food Stamps or SNAP (Last 12 Months), by County
- Population Non-Hispanic Black % by Zip Code (ZCTA5) — New York Metro
- Bachelor's Degree or Higher (% of Over 25) by Zip Code (ZCTA5) — New York Metro
- Household Median Income by Zip Code (ZCTA5) — New York Metro
- Population Non-Hispanic American Indian % by Zip Code (ZCTA5) — New York Metro
- Population Hispanic % by Zip Code (ZCTA5) — New York Metro
- % of Population without Health Insurance, by Zip Code (ZCTA5) — Ohio
- Bachelor's Degree or Higher (% of Over 25) by Zip Code (ZCTA5) — Ohio
- Housing Owner-Occupied % of Units, by Zip Code (ZCTA5) — Ohio
- Population Non-Hispanic White % by Zip Code (ZCTA5) — Ohio
- Population Non-Hispanic American Indian % by Zip Code (ZCTA5) — Ohio
- High School Graduate (% of Over 25) by Zip Code (ZCTA5) — Ohio
- % of Households with Broadband Internet, by Zip Code (ZCTA5) — Ohio
- Median Age by Zip Code (ZCTA5) — Ohio
- Housing Median Monthly Rent ($), by Zip Code (ZCTA5) — Montana
- Housing Median Monthly Rent ($), by Zip Code (ZCTA5) — Virginia
- Housing Median Monthly Rent ($), by Zip Code (ZCTA5) — Maine
- Housing Median Monthly Rent ($), by Zip Code (ZCTA5) — Iowa
- Housing Median Monthly Rent ($), by Zip Code (ZCTA5) — Utah
- Housing Median Monthly Rent ($), by Zip Code (ZCTA5) — Ohio
- Housing Median Monthly Rent ($), by Zip Code (ZCTA5) — Vermont
- Housing Median Monthly Rent ($), by Zip Code (ZCTA5) — Idaho
- Housing Median Monthly Rent ($), by Zip Code (ZCTA5) — Indiana
- Housing Median Monthly Rent ($), by Zip Code (ZCTA5) — Texas