NOTE: Gray indicates insufficient data or a suppressed estimate.
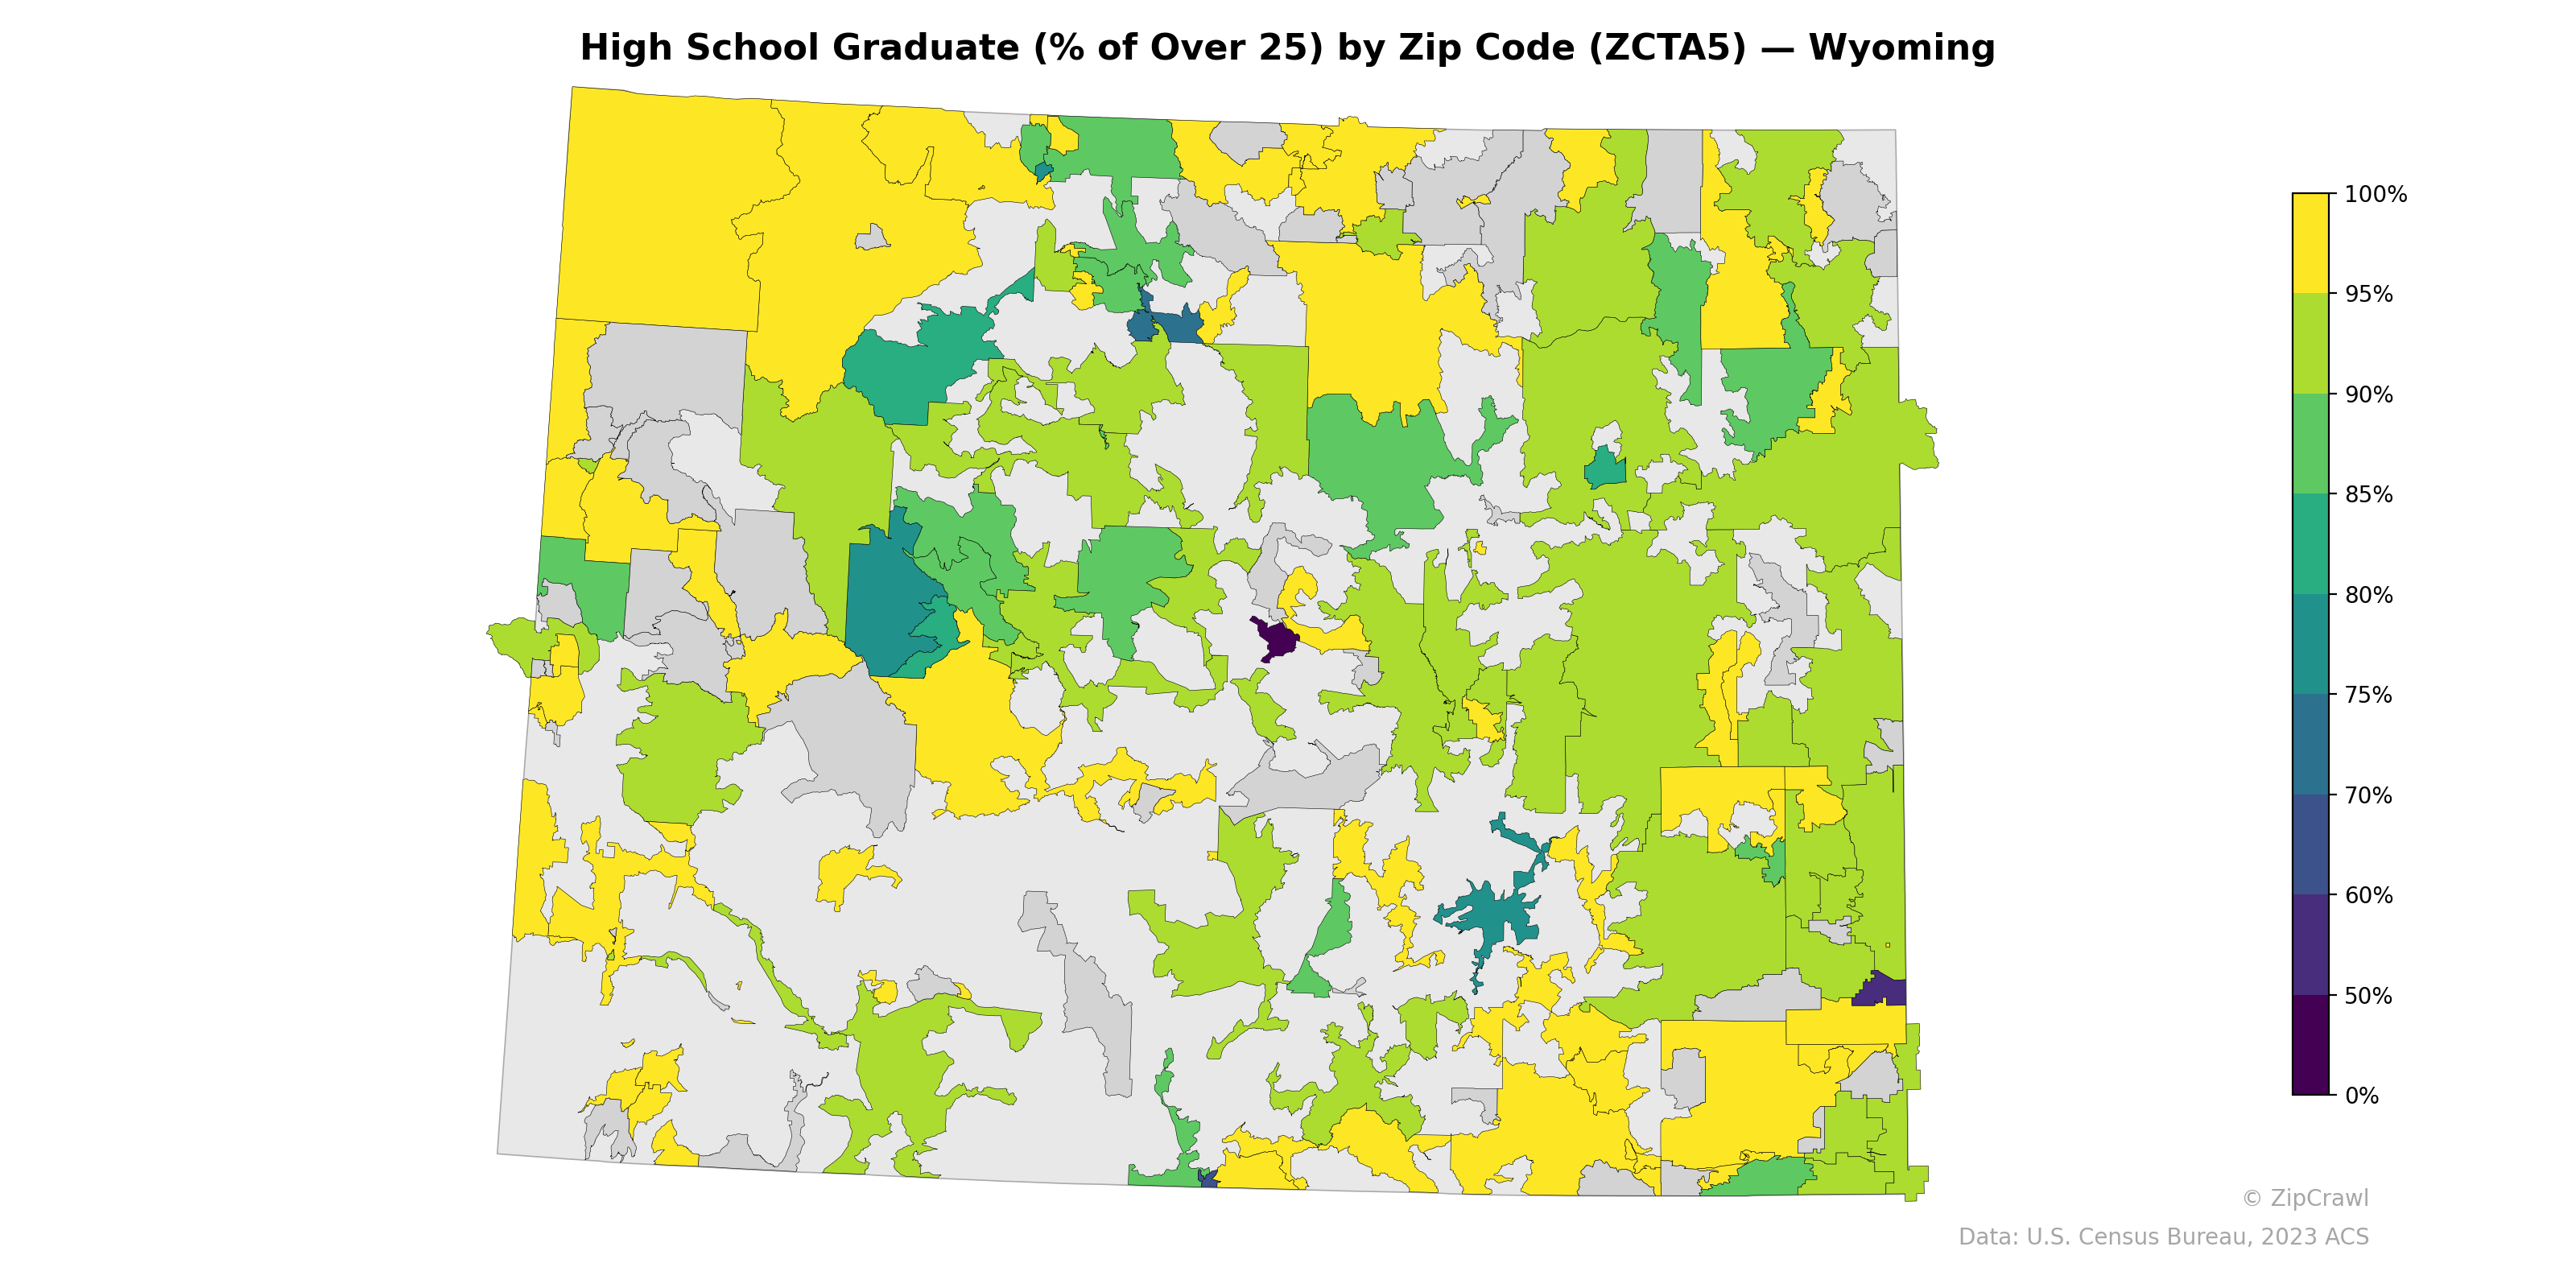
Most Wyoming zip codes exhibit high school graduation rates above 85%, with large swaths of the northwestern and north-central regions displaying rates at or near 95–100%, consistent with rural and suburban communities in areas like the Bighorn Basin and Teton County. Notable exceptions include a cluster of lower-performing zip codes in the south-central to southeastern part of the state—particularly around the Laramie and Carbon County areas—where graduation rates dip into the 50–75% range, likely corresponding to communities with significant non-English-speaking populations or reservation lands. A small dark-shaded outlier is also visible near the center of the state, suggesting a localized pocket where graduation rates fall well below the statewide norm.
Data: U.S. Census Bureau, 2023 ACS
Explore
- U.S. Citizens (% of Population Over 18) by Zip Code (ZCTA5) — Illinois
- Population Non-Hispanic American Indian % by Zip Code (ZCTA5) — Wyoming
- Housing Median Monthly Rent ($), by Zip Code (ZCTA5) — Wyoming
- % of Households with Broadband Internet, by Zip Code (ZCTA5) — Wyoming
- Housing % of Units Built Since 2010, by Zip Code (ZCTA5) — Wyoming
- Household Average Size by Zip Code (ZCTA5) — Wyoming
- Housing Owner-Occupied Median Value ($), by Zip Code (ZCTA5) — Wyoming
- Housing Owner-Occupied % of Units, by Zip Code (ZCTA5) — Wyoming
- % of Population without Health Insurance, by Zip Code (ZCTA5) — Wyoming
- Bachelor's Degree or Higher (% of Over 25) by Zip Code (ZCTA5) — Wyoming
- Married Couple (% of all Households) by County
- Population Non-Hispanic American Indian % by Zip Code (ZCTA5) — Illinois
- % of Population on Food Stamps or SNAP (Last 12 Months), by Zip Code (ZCTA5) — Boston Metro
- Population Non-Hispanic Black % by Zip Code (ZCTA5) — Illinois
- Household Median Income by Zip Code (ZCTA5) — Illinois
- Median Age by Zip Code (ZCTA5) — Illinois
- % of Population on Food Stamps or SNAP (Last 12 Months), by Zip Code (ZCTA5) — New York
- Population Non-Hispanic White % by Zip Code (ZCTA5) — Illinois
- % of Population on Food Stamps or SNAP (Last 12 Months), by Zip Code (ZCTA5) — California
- Population Non-Hispanic Asian % by Zip Code (ZCTA5) — New York
- Population Hispanic % by Zip Code (ZCTA5) — Illinois
- Bachelor's Degree or Higher (% of Over 25) by Zip Code (ZCTA5) — Vermont
- % of Households with Broadband Internet, by Zip Code (ZCTA5) — Vermont
- % of Population on Food Stamps or SNAP (Last 12 Months), by Zip Code (ZCTA5) — Vermont
- Population Hispanic % by Zip Code (ZCTA5) — Washington D.C.
- Housing Vacancy Rate by Zip Code (ZCTA5) — Vermont
- Population Non-Hispanic American Indian % by Zip Code (ZCTA5) — Vermont
- Bachelor's Degree or Higher (% of Over 25) by Zip Code (ZCTA5) — Oregon
- % of Population without Health Insurance, by Zip Code (ZCTA5) — Vermont
- Population Non-Hispanic Asian % by Zip Code (ZCTA5) — Vermont
- High School Graduate (% of Over 25) by Zip Code (ZCTA5) — Ohio
- High School Graduate (% of Over 25) by Zip Code (ZCTA5) — Utah
- High School Graduate (% of Over 25) by Zip Code (ZCTA5) — Iowa
- High School Graduate (% of Over 25) by Zip Code (ZCTA5) — Maine
- High School Graduate (% of Over 25) by Zip Code (ZCTA5) — Texas
- High School Graduate (% of Over 25) by Zip Code (ZCTA5) — Colorado
- High School Graduate (% of Over 25) by Zip Code (ZCTA5) — Idaho
- High School Graduate (% of Over 25) by Zip Code (ZCTA5) — Oregon
- High School Graduate (% of Over 25) by Zip Code (ZCTA5) — Hawaii
- High School Graduate (% of Over 25) by Zip Code (ZCTA5) — Washington