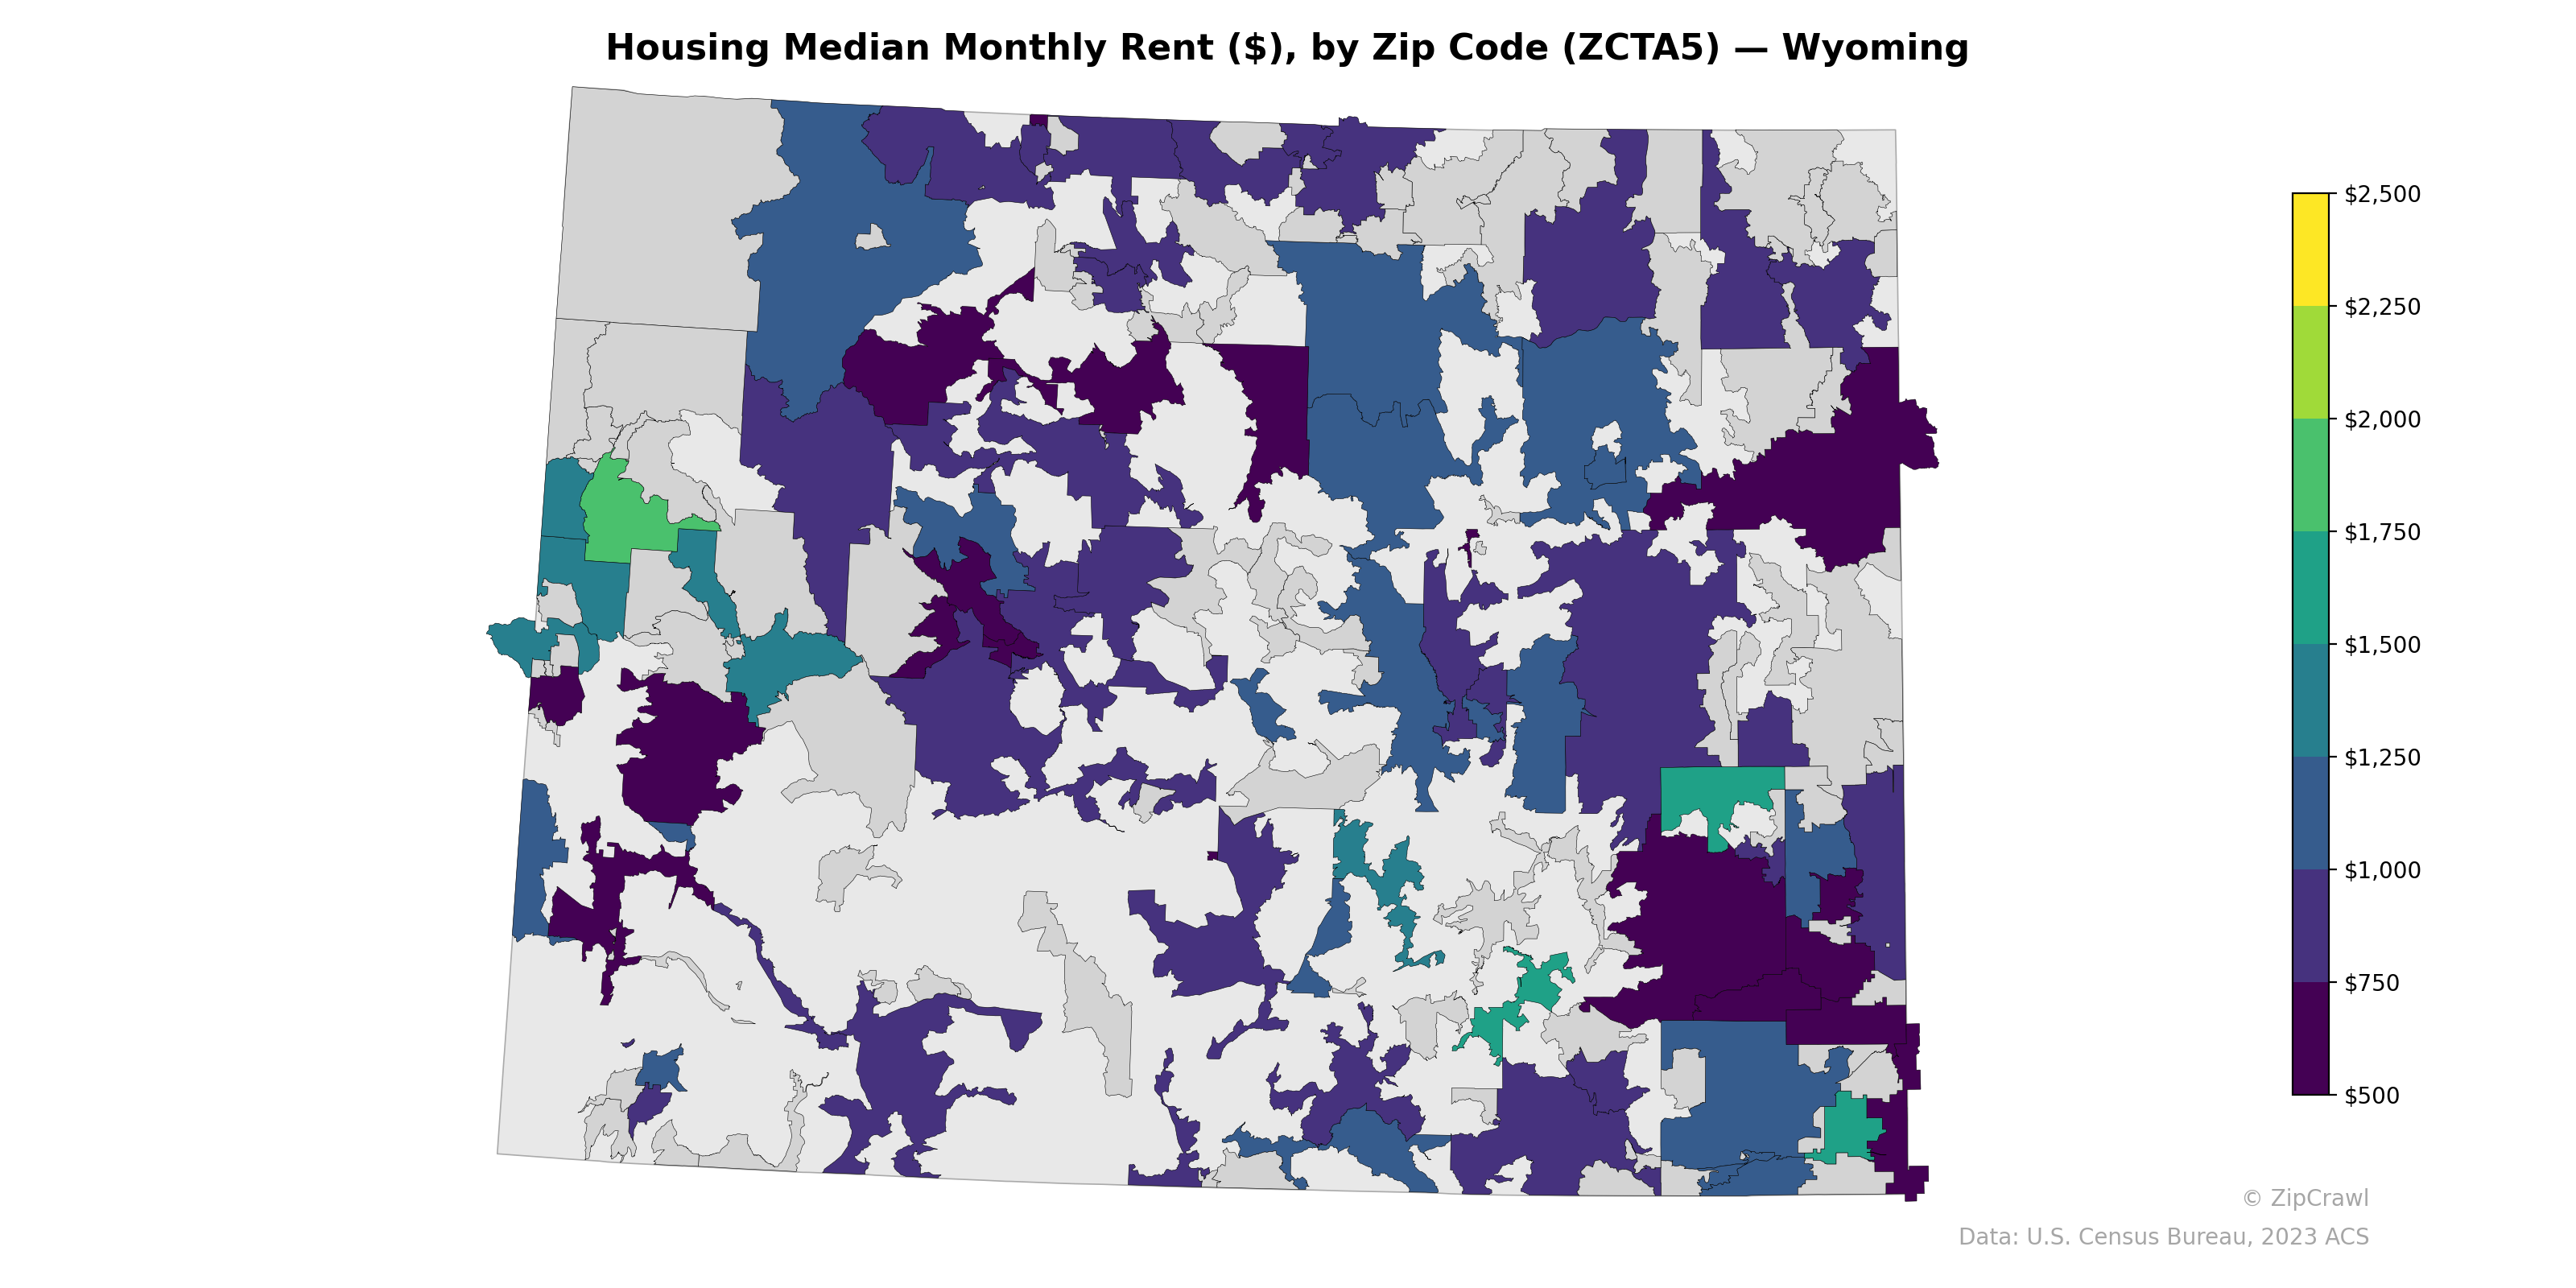
NOTE: Gray indicates insufficient data or a suppressed estimate.
Median monthly rents across Wyoming zip codes predominantly fall in the $500–$1,000 range, with notable concentrations of higher rents in the northwestern corner near Jackson (Teton County), where values approach or exceed $2,000, reflecting the area's resort-driven housing market. The southeastern corridor around Cheyenne and Laramie displays moderate rents in the $750–$1,250 range, while much of the central and eastern portions of the state show lower rents interspersed with gray areas indicating insufficient data in sparsely populated zip codes. A striking contrast exists between the deeply purple low-rent zones scattered across the interior and the teal-to-green pockets near Jackson and parts of the south-central region, underscoring the outsized influence of tourism and energy-sector economies on local housing costs.
Data: U.S. Census Bureau, 2023 ACS
Explore
- U.S. Citizens (% of Population Over 18) by Zip Code (ZCTA5) — Illinois
- Household Average Size by Zip Code (ZCTA5) — Wyoming
- Housing Owner-Occupied Median Value ($), by Zip Code (ZCTA5) — Wyoming
- Bachelor's Degree or Higher (% of Over 25) by Zip Code (ZCTA5) — Wyoming
- Population Non-Hispanic American Indian % by Zip Code (ZCTA5) — Wyoming
- Housing % of Units Built Since 2010, by Zip Code (ZCTA5) — Wyoming
- Housing Owner-Occupied % of Units, by Zip Code (ZCTA5) — Wyoming
- % of Population without Health Insurance, by Zip Code (ZCTA5) — Wyoming
- % of Households with Broadband Internet, by Zip Code (ZCTA5) — Wyoming
- High School Graduate (% of Over 25) by Zip Code (ZCTA5) — Wyoming
- Married Couple (% of all Households) by County
- Population Non-Hispanic Black % by Zip Code (ZCTA5) — Illinois
- High School Graduate (% of Over 25) by Zip Code (ZCTA5) — Illinois
- Population Non-Hispanic American Indian % by Zip Code (ZCTA5) — Illinois
- Population Non-Hispanic Black % by Zip Code (ZCTA5) — San Francisco Metro
- Median Age by Zip Code (ZCTA5) — Illinois
- % of Population on Food Stamps or SNAP (Last 12 Months), by Zip Code (ZCTA5) — New York
- Population Non-Hispanic White % by Zip Code (ZCTA5) — Illinois
- Population Non-Hispanic Black % by Zip Code (ZCTA5) — Florida
- Population Non-Hispanic Asian % by Zip Code (ZCTA5) — New York
- Population Hispanic % by Zip Code (ZCTA5) — Illinois
- Household Median Income by Zip Code (ZCTA5) — Illinois
- Population Non-Hispanic American Indian % by Zip Code (ZCTA5) — Vermont
- Bachelor's Degree or Higher (% of Over 25) by Zip Code (ZCTA5) — Vermont
- Population Non-Hispanic Asian % by Zip Code (ZCTA5) — Vermont
- Population Hispanic % by Zip Code (ZCTA5) — Washington D.C.
- High School Graduate (% of Over 25) by Zip Code (ZCTA5) — Vermont
- Bachelor's Degree or Higher (% of Over 25) by Zip Code (ZCTA5) — Oregon
- % of Households with Broadband Internet, by Zip Code (ZCTA5) — Vermont
- Housing Vacancy Rate by Zip Code (ZCTA5) — Vermont
- Housing Median Monthly Rent ($), by Zip Code (ZCTA5) — Montana
- Housing Median Monthly Rent ($), by Zip Code (ZCTA5) — Iowa
- Housing Median Monthly Rent ($), by Zip Code (ZCTA5) — Maine
- Housing Median Monthly Rent ($), by Zip Code (ZCTA5) — Vermont
- Housing Median Monthly Rent ($), by Zip Code (ZCTA5) — Utah
- Housing Median Monthly Rent ($), by Zip Code (ZCTA5) — Ohio
- Housing Median Monthly Rent ($), by Zip Code (ZCTA5) — Hawaii
- Housing Median Monthly Rent ($), by Zip Code (ZCTA5) — Indiana
- Housing Median Monthly Rent ($), by Zip Code (ZCTA5) — Idaho
- Housing Median Monthly Rent ($), by Zip Code (ZCTA5) — Texas