NOTE: Gray indicates insufficient data or a suppressed estimate.
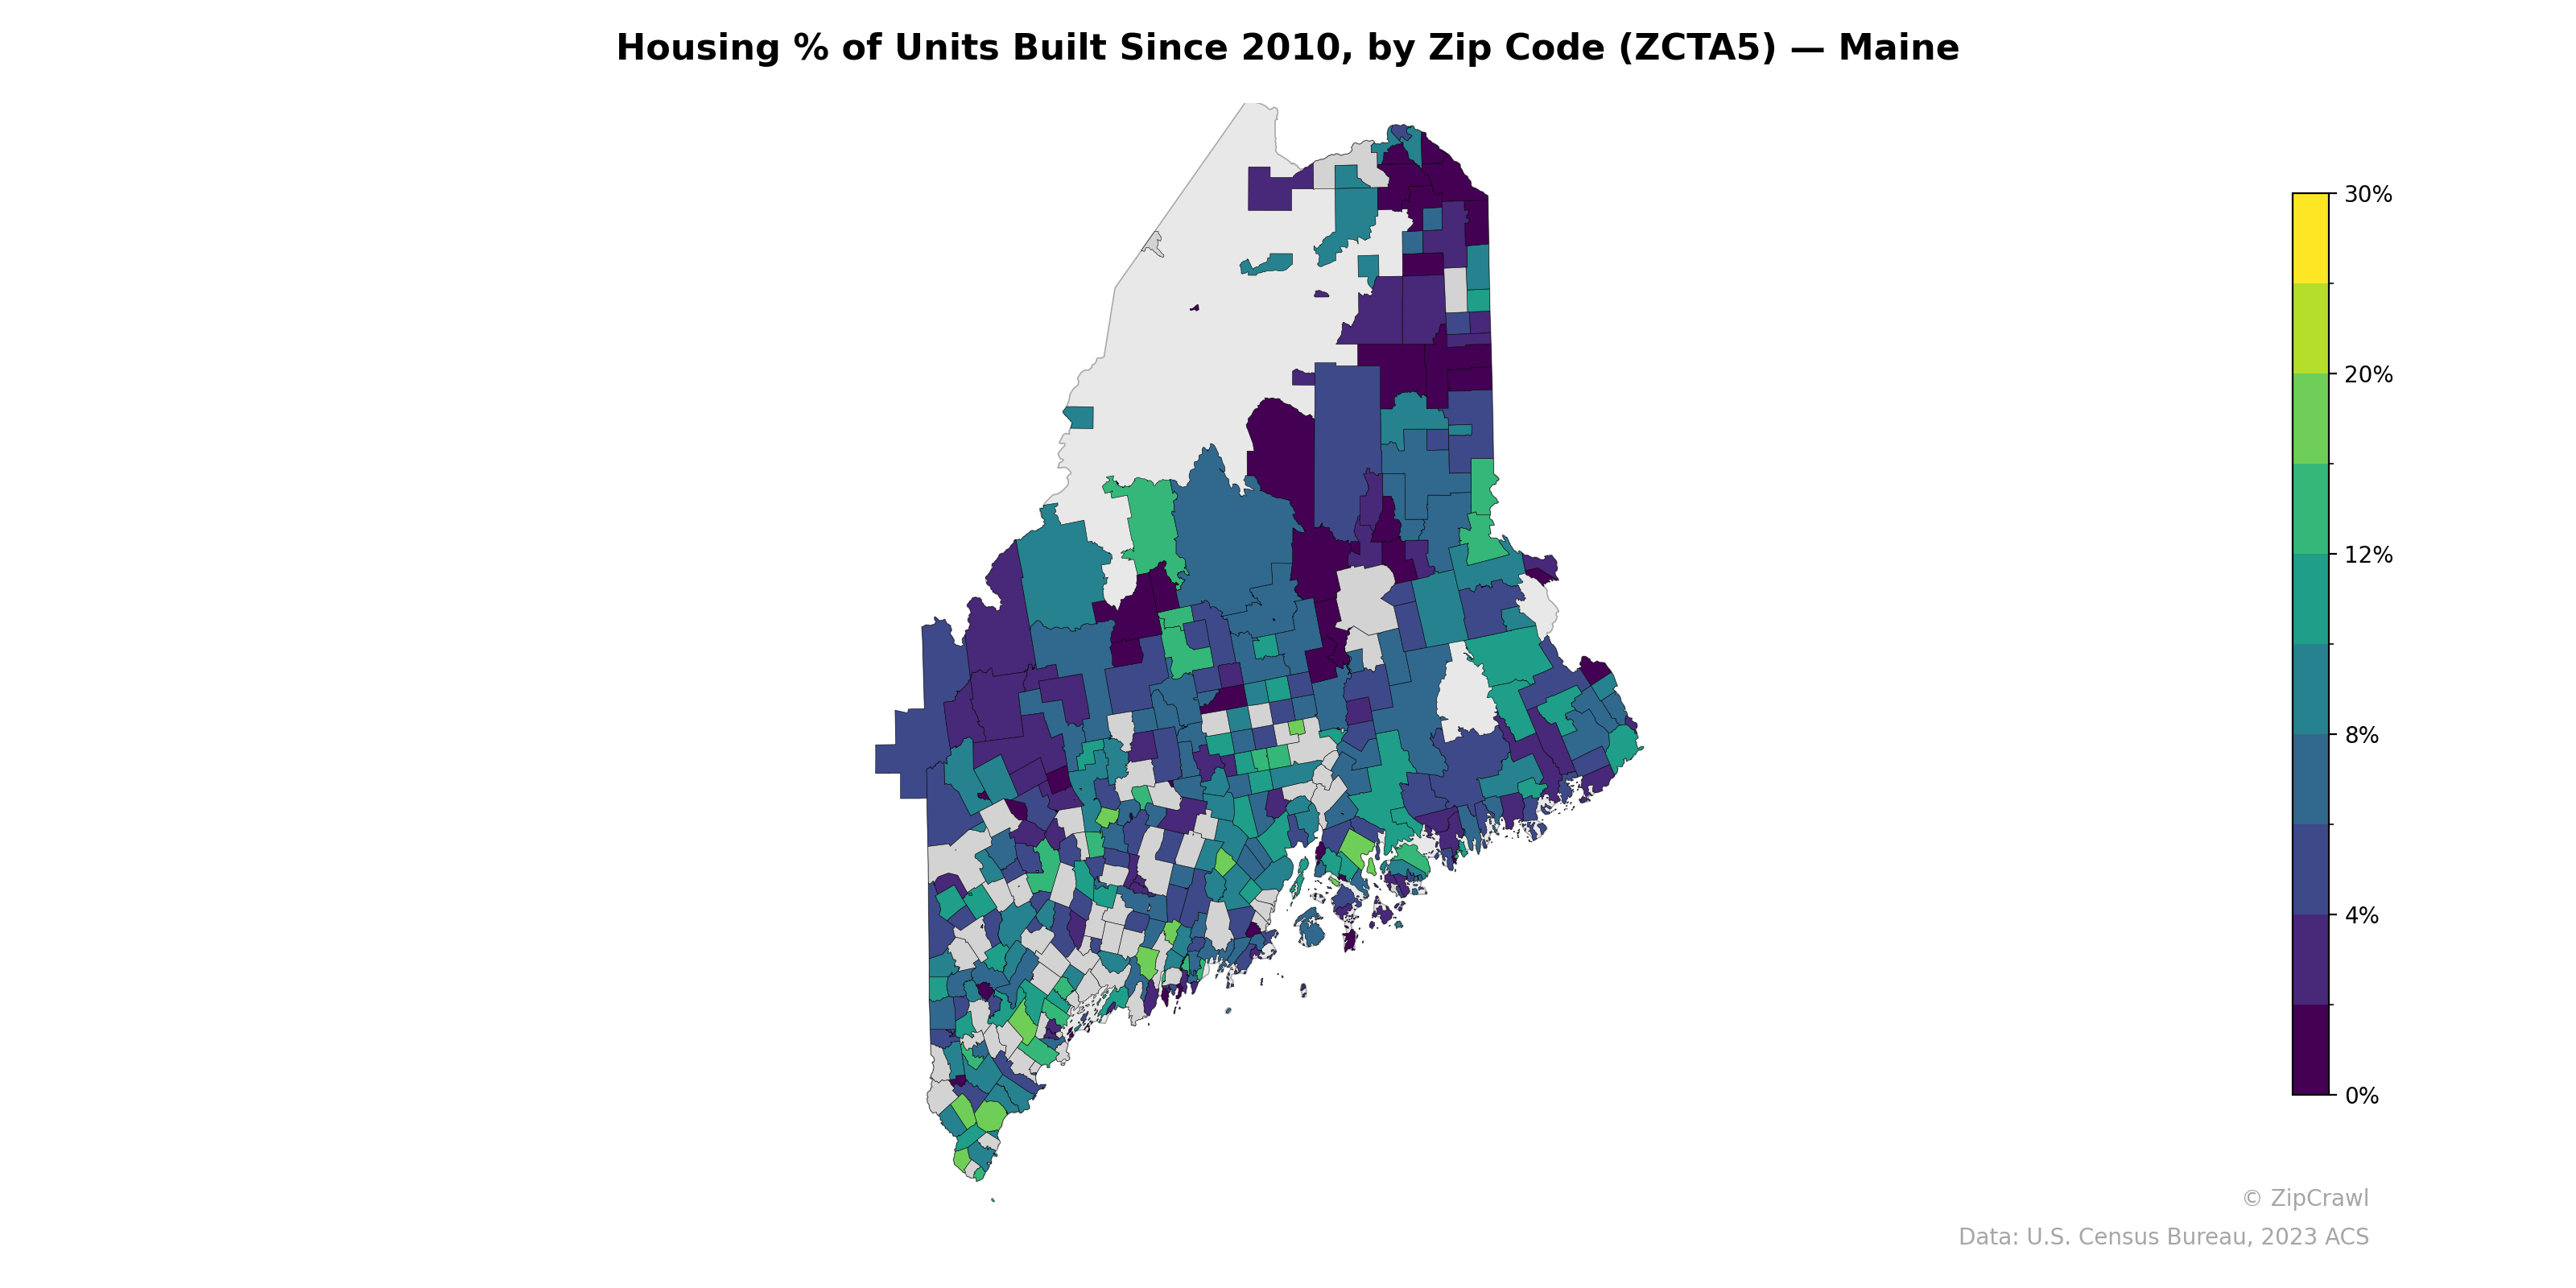
Newer housing construction is concentrated in the central and western interior of Maine, where several zip codes in the greater Augusta and central highlands areas display rates of 8–12% or higher, with scattered pockets reaching above 20%. Coastal southern Maine and the far northern Aroostook County regions generally exhibit lower shares of post-2010 construction, with many zip codes falling below 4%, suggesting aging housing stock and limited new development. The contrast is particularly stark along the eastern coastline and Downeast region, where deep purple shading indicates near-zero new construction in multiple adjacent zip codes, while isolated green pockets in the midcoast and western mountains reflect localized development activity.
Data: U.S. Census Bureau, 2023 ACS
Explore
- Population Hispanic % by Zip Code (ZCTA5) — New York
- Housing Owner-Occupied Median Value ($), by Zip Code (ZCTA5) — Maine
- Housing Owner-Occupied % of Units, by Zip Code (ZCTA5) — Maine
- Bachelor's Degree or Higher (% of Over 25) by Zip Code (ZCTA5) — Maine
- Housing Median Monthly Rent ($), by Zip Code (ZCTA5) — Maine
- Household Average Size by Zip Code (ZCTA5) — Maine
- % of Population without Health Insurance, by Zip Code (ZCTA5) — Maine
- % of Households with Broadband Internet, by Zip Code (ZCTA5) — Maine
- Population Non-Hispanic American Indian % by Zip Code (ZCTA5) — Maine
- High School Graduate (% of Over 25) by Zip Code (ZCTA5) — Maine
- U.S. Citizens by County (% of Population Over 18)
- Population Non-Hispanic American Indian % by Zip Code (ZCTA5) — Illinois
- Population Non-Hispanic American Indian % by Zip Code (ZCTA5) — Washington
- High School Graduate (% of Over 25) by Zip Code (ZCTA5) — New York
- Population Non-Hispanic White % by Zip Code (ZCTA5) — New York
- Household Median Income by Zip Code (ZCTA5) — New York
- Population Non-Hispanic Black % by Zip Code (ZCTA5) — New York
- Population Non-Hispanic Asian % by Zip Code (ZCTA5) — Florida
- % of Population on Food Stamps or SNAP (Last 12 Months), by Zip Code (ZCTA5) — Florida
- U.S. Citizens (% of Population Over 18) by Zip Code (ZCTA5) — New York
- Population Non-Hispanic American Indian % by Zip Code (ZCTA5) — New York
- Median Age by Zip Code (ZCTA5) — New York
- % of Households with Broadband Internet, by Zip Code (ZCTA5) — West Virginia
- High School Graduate (% of Over 25) by Zip Code (ZCTA5) — West Virginia
- Population Non-Hispanic Asian % by Zip Code (ZCTA5) — West Virginia
- Population Hispanic % by Zip Code (ZCTA5) — Hawaii
- Married Couple (% of all Households) by Zip Code (ZCTA5) — West Virginia
- Population Non-Hispanic American Indian % by Zip Code (ZCTA5) — West Virginia
- Bachelor's Degree or Higher (% of Over 25) by Zip Code (ZCTA5) — West Virginia
- % of Population without Health Insurance, by Zip Code (ZCTA5) — West Virginia
- Housing % of Units Built Since 2010, by Zip Code (ZCTA5) — Ohio
- Housing % of Units Built Since 2010, by Zip Code (ZCTA5) — Utah
- Housing % of Units Built Since 2010, by Zip Code (ZCTA5) — Maryland
- Housing % of Units Built Since 2010, by Zip Code (ZCTA5) — Iowa
- Housing % of Units Built Since 2010, by Zip Code (ZCTA5) — Montana
- Housing % of Units Built Since 2010, by Zip Code (ZCTA5) — Oregon
- Housing % of Units Built Since 2010, by Zip Code (ZCTA5) — Idaho
- Housing % of Units Built Since 2010, by Zip Code (ZCTA5) — Texas
- Housing % of Units Built Since 2010, by Zip Code (ZCTA5) — Hawaii
- Housing % of Units Built Since 2010, by Zip Code (ZCTA5) — Wyoming