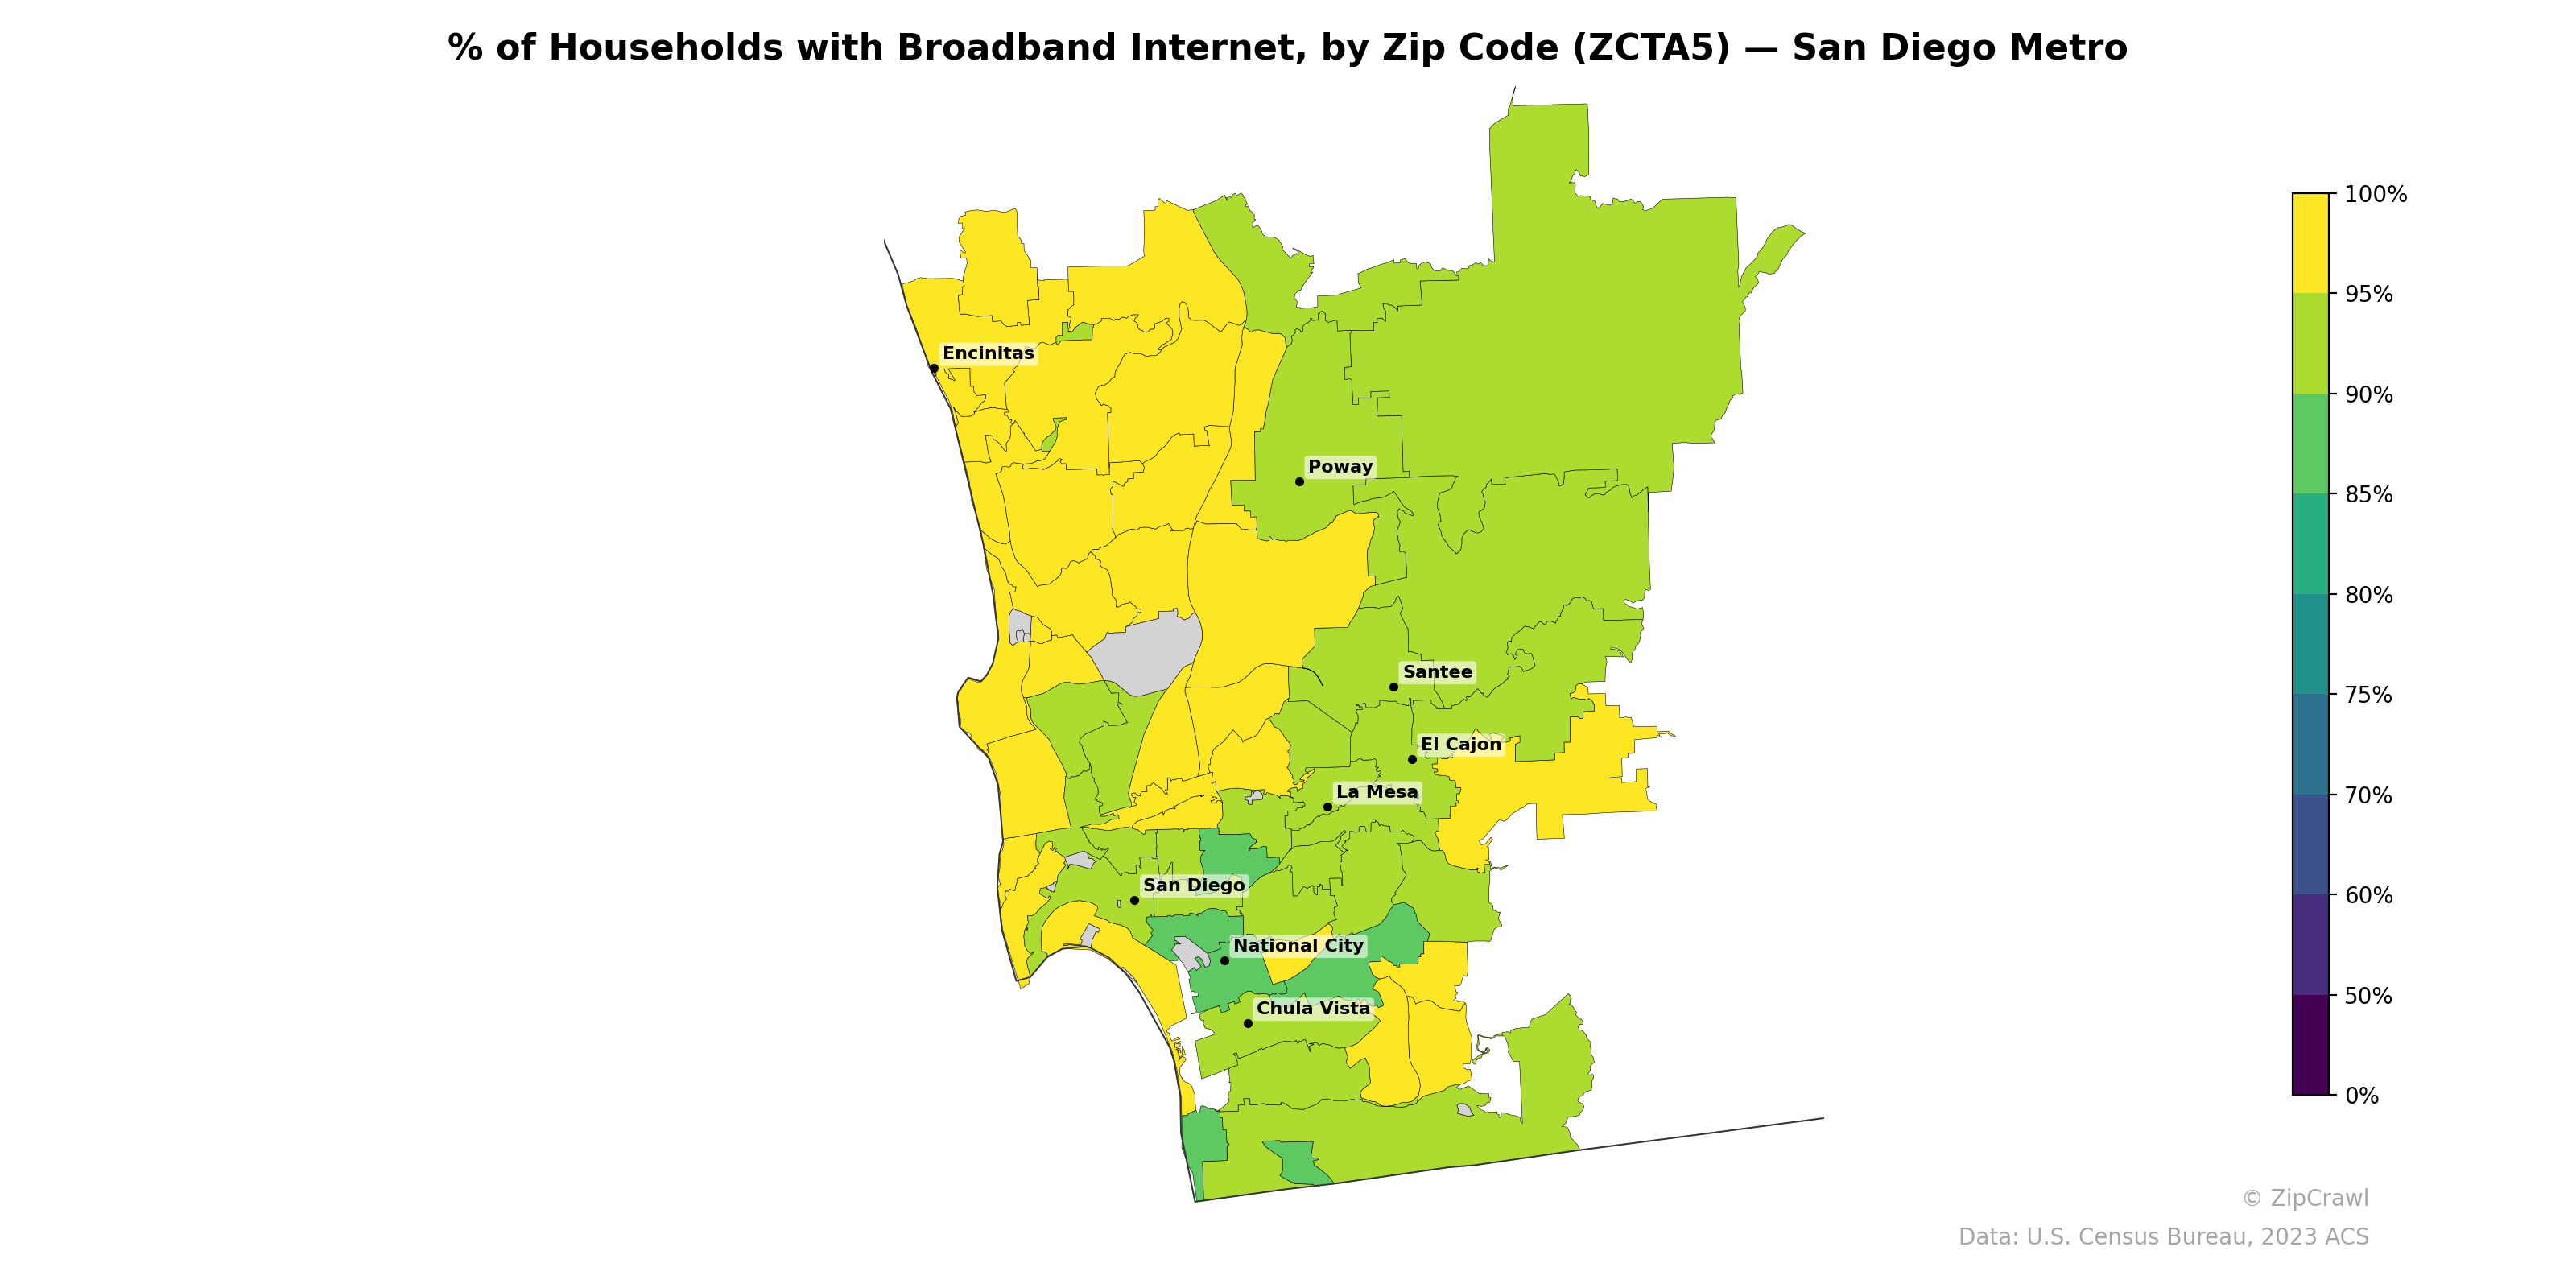
NOTE: Gray indicates insufficient data or a suppressed estimate.
Broadband adoption across the San Diego metro is generally high, with most zip codes exceeding 80%, though a clear north-south gradient emerges as coastal and northern inland communities like Encinitas and Poway display rates approaching or exceeding 95%, while central urban and southern areas around National City, San Diego's urban core, and portions of Chula Vista drop into the 65–80% range. The lowest broadband penetration clusters tightly around National City and adjacent south San Diego neighborhoods, likely correlating with lower-income demographics, while the large eastern zip codes maintaining solidly yellow (90%+) shading suggest that even suburban and semi-rural areas in Santee and eastern Poway benefit from robust connectivity infrastructure.
Data: U.S. Census Bureau, 2023 ACS
Explore
- Housing Owner-Occupied % of Units, by Zip Code (ZCTA5) — Chicago Metro
- Married Couple (% of all Households) by Zip Code (ZCTA5) — San Diego Metro
- Bachelor's Degree or Higher (% of Over 25) by Zip Code (ZCTA5) — San Diego Metro
- Housing Vacancy Rate by Zip Code (ZCTA5) — San Diego Metro
- Household Average Size by Zip Code (ZCTA5) — San Diego Metro
- Housing Owner-Occupied % of Units, by Zip Code (ZCTA5) — San Diego Metro
- Housing Median Monthly Rent ($), by Zip Code (ZCTA5) — San Diego Metro
- Housing Owner-Occupied Median Value ($), by Zip Code (ZCTA5) — San Diego Metro
- % of Population without Health Insurance, by Zip Code (ZCTA5) — San Diego Metro
- Housing % of Units Built Since 2010, by Zip Code (ZCTA5) — San Diego Metro
- Population Non-Hispanic American Indian % by County
- Household Average Size by Zip Code (ZCTA5) — Chicago Metro
- Housing Vacancy Rate by Zip Code (ZCTA5) — Chicago Metro
- Housing Median Monthly Rent ($), by Zip Code (ZCTA5) — Chicago Metro
- Married Couple (% of all Households) by Zip Code (ZCTA5) — Chicago Metro
- % of Population without Health Insurance, by Zip Code (ZCTA5) — Chicago Metro
- Bachelor's Degree or Higher (% of Over 25) by Zip Code (ZCTA5) — Chicago Metro
- Housing Owner-Occupied Median Value ($), by Zip Code (ZCTA5) — Chicago Metro
- Housing % of Units Built Since 2010, by Zip Code (ZCTA5) — Chicago Metro
- Married Couple (% of all Households) by Zip Code (ZCTA5) — Denver Metro
- Housing % of Units Built Since 2010, by Zip Code (ZCTA5) — Denver Metro
- Housing Vacancy Rate by Zip Code (ZCTA5) — Denver Metro
- High School Graduate (% of Over 25) by Zip Code (ZCTA5) — Denver Metro
- % of Population without Health Insurance, by Zip Code (ZCTA5) — Denver Metro
- Population Non-Hispanic Black % by Zip Code (ZCTA5) — Denver Metro
- Bachelor's Degree or Higher (% of Over 25) by Zip Code (ZCTA5) — Denver Metro
- Population Hispanic % by Zip Code (ZCTA5) — Denver Metro
- Housing Owner-Occupied Median Value ($), by Zip Code (ZCTA5) — Denver Metro
- Household Average Size by Zip Code (ZCTA5) — Denver Metro
- Population Non-Hispanic American Indian % by Zip Code (ZCTA5) — Denver Metro
- % of Households with Broadband Internet, by Zip Code (ZCTA5) — San Antonio Metro
- % of Households with Broadband Internet, by Zip Code (ZCTA5) — Detroit Metro
- % of Households with Broadband Internet, by Zip Code (ZCTA5) — Houston Metro
- % of Households with Broadband Internet, by Zip Code (ZCTA5) — Chicago Metro
- % of Households with Broadband Internet, by Zip Code (ZCTA5) — Dallas Metro
- % of Households with Broadband Internet, by Zip Code (ZCTA5) — Denver Metro
- % of Households with Broadband Internet, by Zip Code (ZCTA5) — Miami Metro
- % of Households with Broadband Internet, by Zip Code (ZCTA5) — San Francisco Metro
- % of Households with Broadband Internet, by Zip Code (ZCTA5) — Seattle Metro
- % of Households with Broadband Internet, by Zip Code (ZCTA5) — Boston Metro