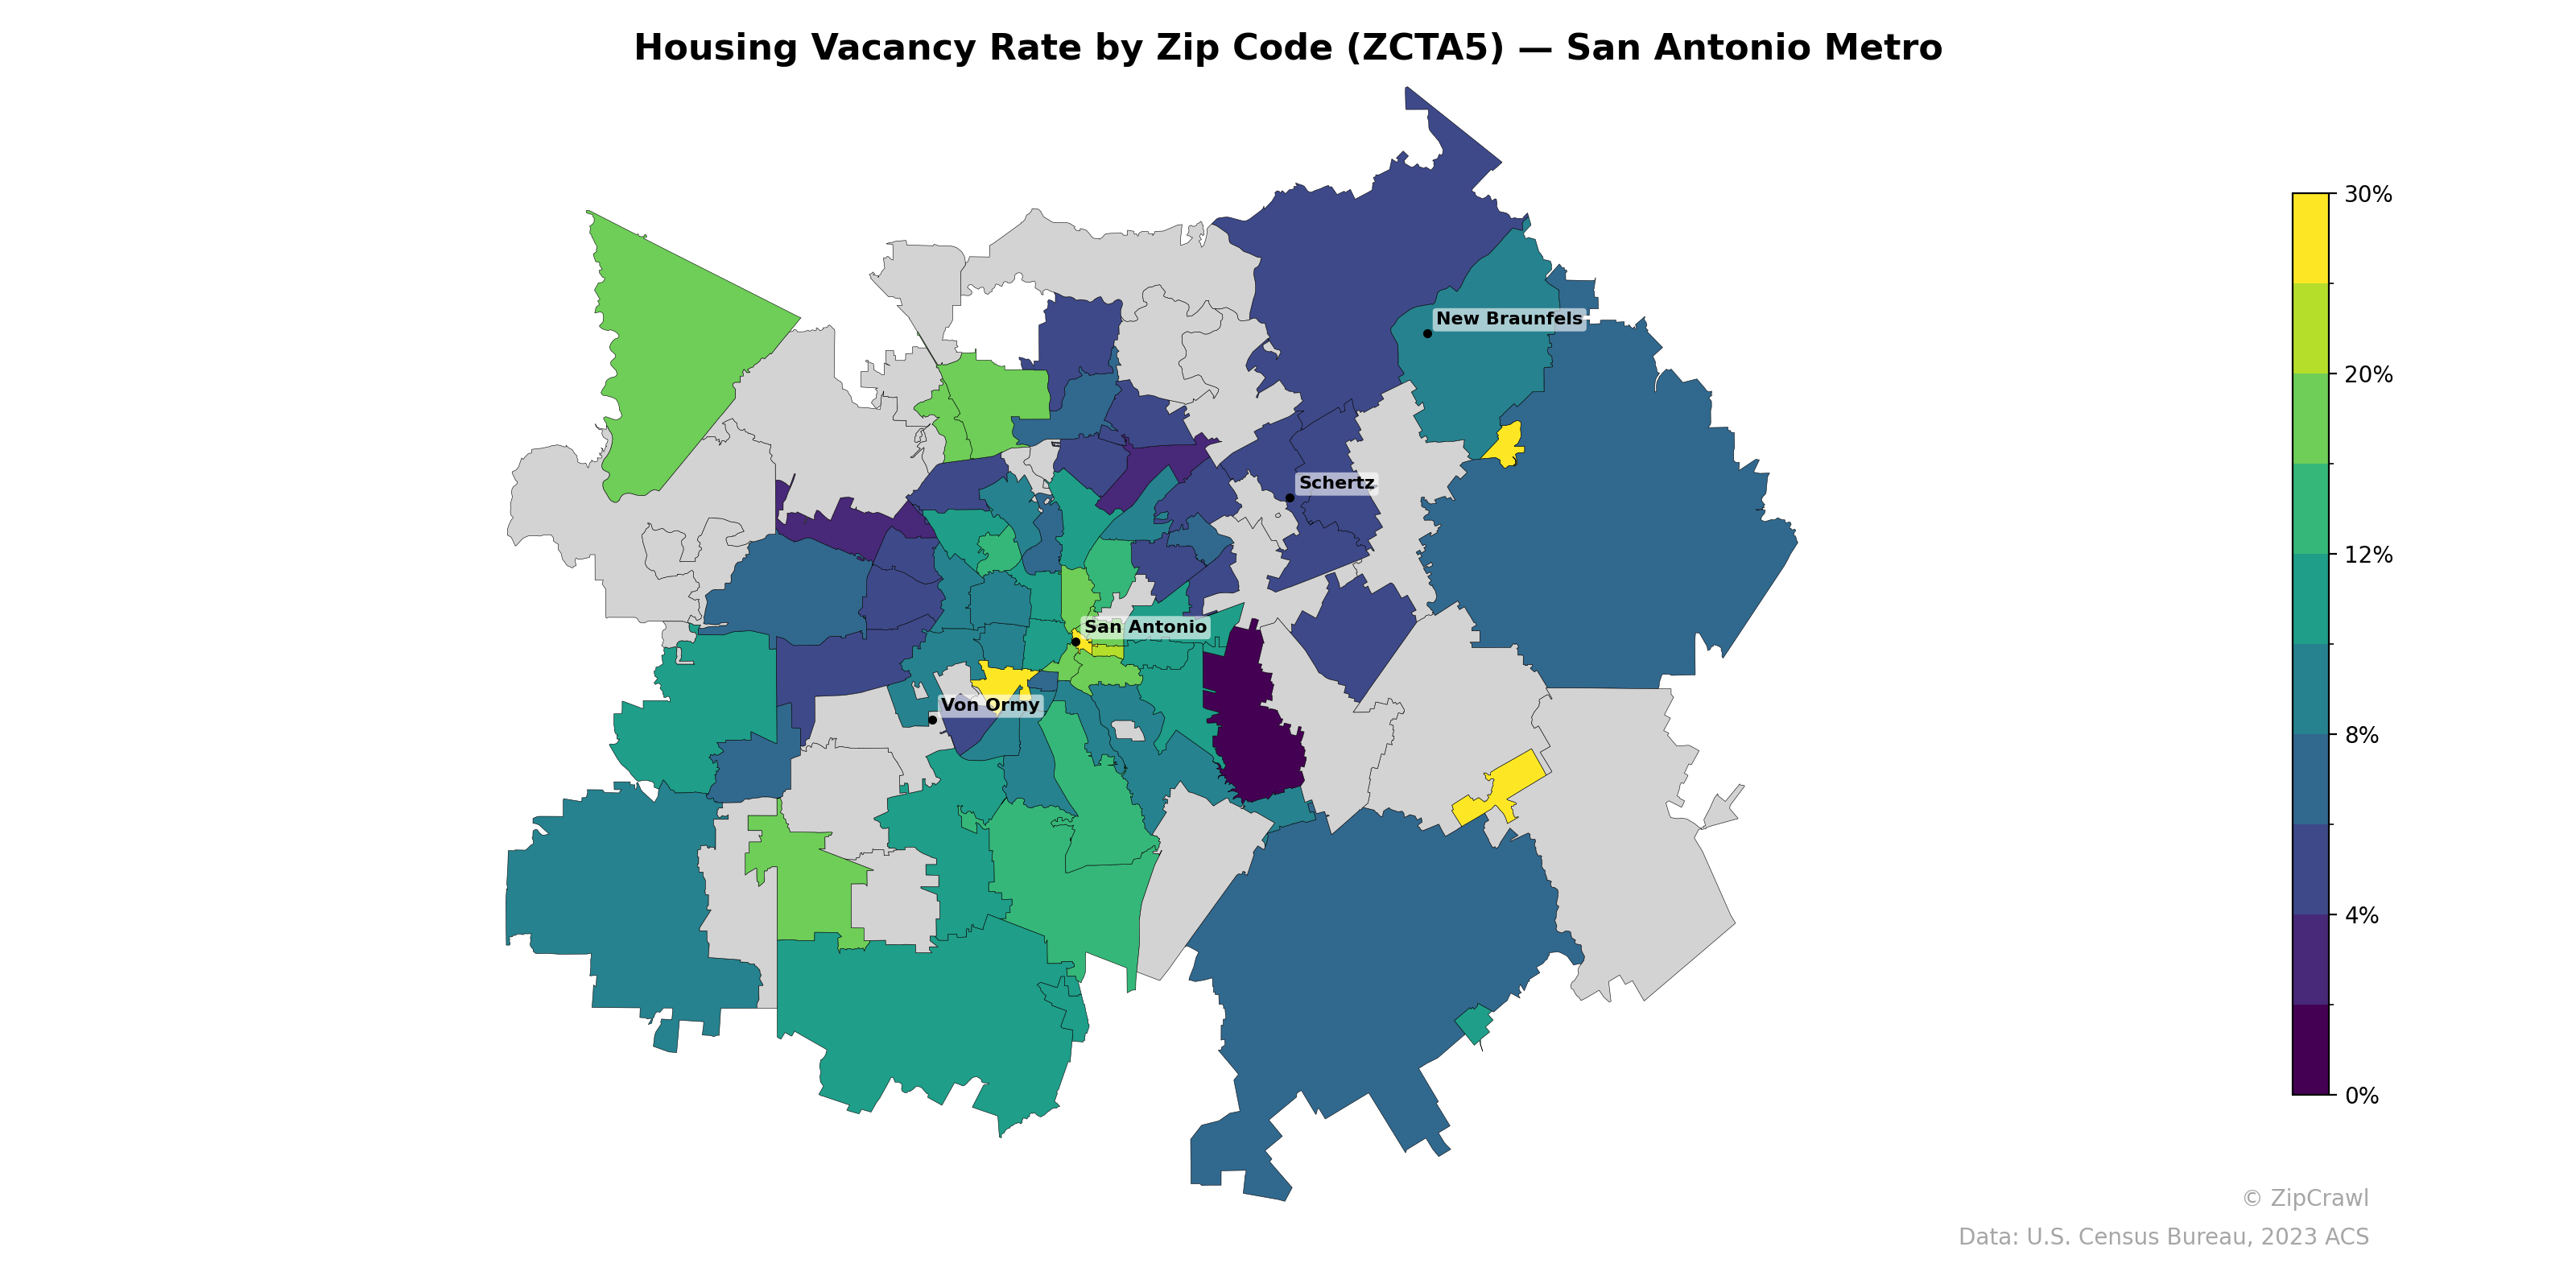
NOTE: Gray indicates insufficient data or a suppressed estimate.
Housing vacancy rates across the San Antonio metro exhibit a clear core-periphery gradient, with several inner-city zip codes near downtown San Antonio registering the lowest rates (under 4%), while outer suburban and rural zip codes to the southwest, south, and northwest display elevated rates in the 8–12% range. A notable cluster of higher vacancy (approaching 12–16%) appears in the southwestern quadrants extending toward Von Ormy, contrasting sharply with the tight, low-vacancy corridor running northeast through Schertz and toward New Braunfels. A few small zip codes near the urban core and southeast of downtown stand out as deep purple outliers with near-zero vacancy, suggesting fully occupied or supply-constrained housing markets.
Data: U.S. Census Bureau, 2023 ACS
Explore
- Population Non-Hispanic White % by Zip Code (ZCTA5) — Texas
- % of Households with Broadband Internet, by Zip Code (ZCTA5) — San Antonio Metro
- Bachelor's Degree or Higher (% of Over 25) by Zip Code (ZCTA5) — San Antonio Metro
- Housing % of Units Built Since 2010, by Zip Code (ZCTA5) — San Antonio Metro
- Household Average Size by Zip Code (ZCTA5) — San Antonio Metro
- % of Population without Health Insurance, by Zip Code (ZCTA5) — San Antonio Metro
- Married Couple (% of all Households) by Zip Code (ZCTA5) — San Antonio Metro
- Housing Owner-Occupied % of Units, by Zip Code (ZCTA5) — San Antonio Metro
- Housing Owner-Occupied Median Value ($), by Zip Code (ZCTA5) — San Antonio Metro
- Housing Median Monthly Rent ($), by Zip Code (ZCTA5) — San Antonio Metro
- High School Graduate (% of Over 25) by County
- U.S. Citizens (% of Population Over 18) by Zip Code (ZCTA5) — Texas
- Household Median Income by Zip Code (ZCTA5) — Texas
- Population Non-Hispanic Asian % by Zip Code (ZCTA5) — Chicago Metro
- Population Hispanic % by Zip Code (ZCTA5) — Texas
- Population Non-Hispanic American Indian % by Zip Code (ZCTA5) — Texas
- Median Age by Zip Code (ZCTA5) — Texas
- Population Non-Hispanic Black % by Zip Code (ZCTA5) — Texas
- High School Graduate (% of Over 25) by Zip Code (ZCTA5) — Texas
- % of Population on Food Stamps or SNAP (Last 12 Months), by Zip Code (ZCTA5) — Chicago Metro
- % of Households with Broadband Internet, by Zip Code (ZCTA5) — Baltimore Metro
- Bachelor's Degree or Higher (% of Over 25) by Zip Code (ZCTA5) — Baltimore Metro
- % of Population without Health Insurance, by Zip Code (ZCTA5) — Baltimore Metro
- Population Non-Hispanic Asian % by Zip Code (ZCTA5) — Charlotte Metro
- Population Non-Hispanic Black % by Zip Code (ZCTA5) — Wisconsin
- % of Population on Food Stamps or SNAP (Last 12 Months), by Zip Code (ZCTA5) — Charlotte Metro
- Household Median Income by Zip Code (ZCTA5) — Baltimore Metro
- High School Graduate (% of Over 25) by Zip Code (ZCTA5) — Baltimore Metro
- Population Non-Hispanic American Indian % by Zip Code (ZCTA5) — Baltimore Metro
- Population Non-Hispanic Black % by Zip Code (ZCTA5) — Baltimore Metro
- Housing Vacancy Rate by Zip Code (ZCTA5) — San Diego Metro
- Housing Vacancy Rate by Zip Code (ZCTA5) — Houston Metro
- Housing Vacancy Rate by Zip Code (ZCTA5) — Atlanta Metro
- Housing Vacancy Rate by Zip Code (ZCTA5) — San Francisco Metro
- Housing Vacancy Rate by Zip Code (ZCTA5) — Boston Metro
- Housing Vacancy Rate by Zip Code (ZCTA5) — Austin Metro
- Housing Vacancy Rate by Zip Code (ZCTA5) — Miami Metro
- Housing Vacancy Rate by Zip Code (ZCTA5) — Seattle Metro
- Housing Vacancy Rate by Zip Code (ZCTA5) — Detroit Metro
- Housing Vacancy Rate by Zip Code (ZCTA5) — Tampa Metro