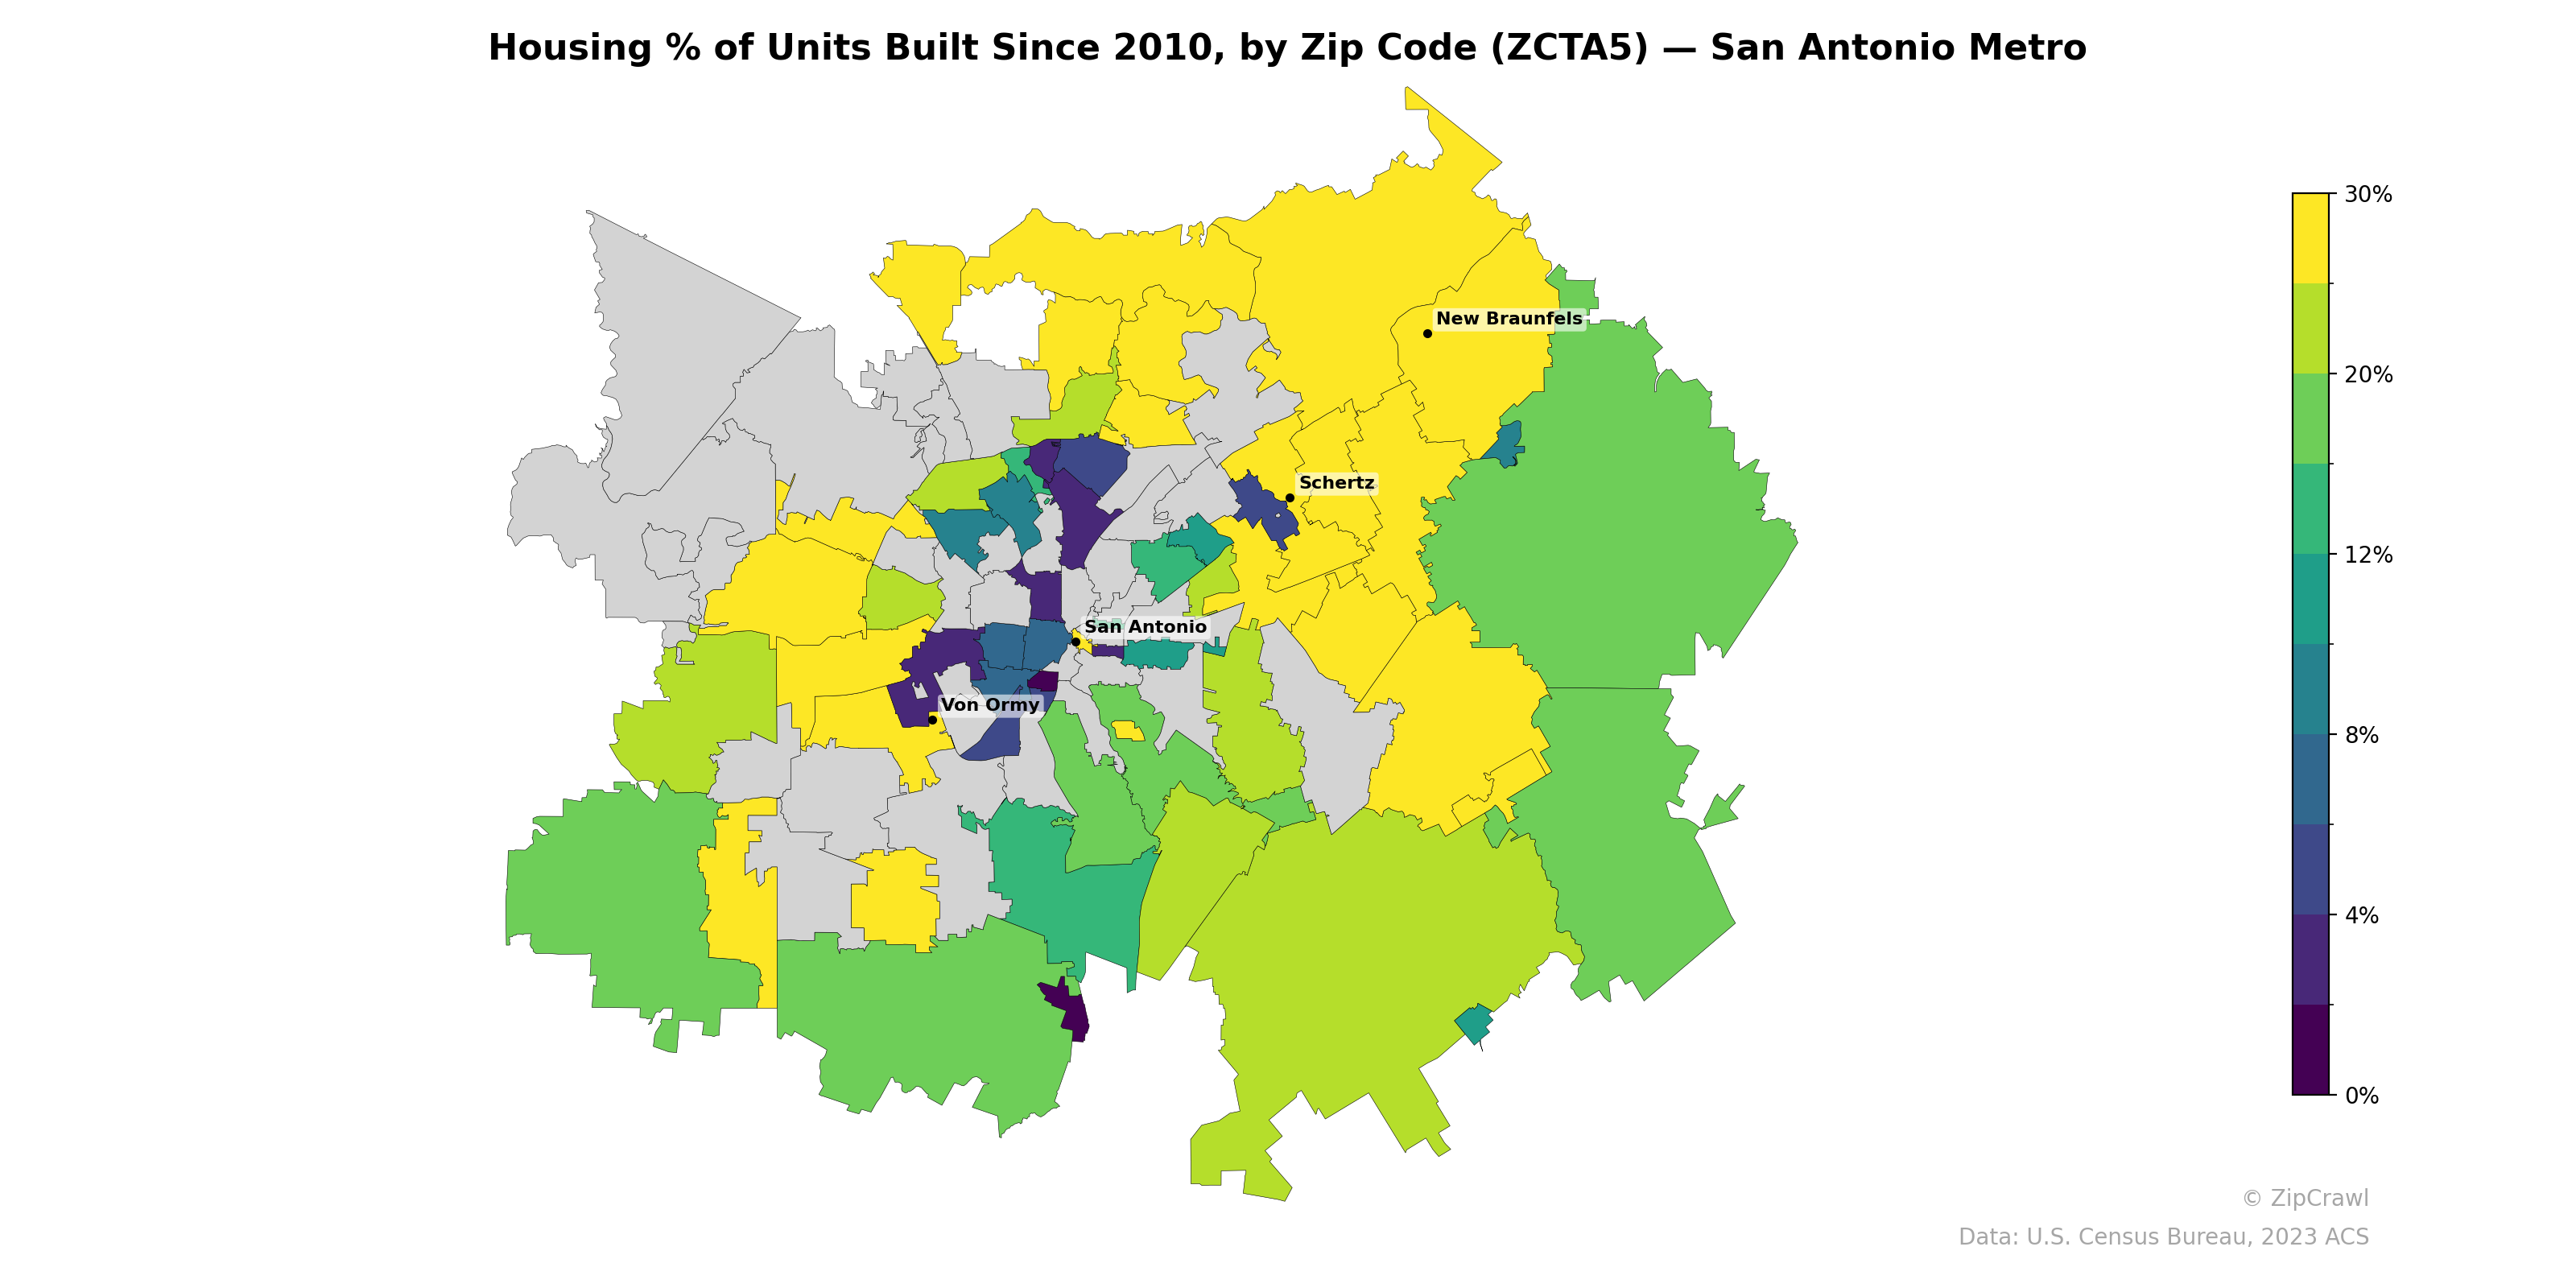
NOTE: Gray indicates insufficient data or a suppressed estimate.
The San Antonio metro exhibits a clear core-periphery pattern, with the oldest housing stock concentrated in the urban center around downtown San Antonio and Von Ormy, where many zip codes show less than 4% of units built since 2010. Newer construction is heavily concentrated in the outer suburban ring, particularly along the northern and northeastern corridors toward New Braunfels and Schertz, as well as in the far southern and southwestern periphery, where zip codes frequently exceed 20–30% post-2010 construction. The northwest quadrant shows notably mixed development, with pockets of high recent construction interspersed among areas with minimal new building, while several gray-shaded zones across the metro suggest data suppression or minimal housing activity.
Data: U.S. Census Bureau, 2023 ACS
Explore
- Population Non-Hispanic White % by Zip Code (ZCTA5) — Texas
- % of Households with Broadband Internet, by Zip Code (ZCTA5) — San Antonio Metro
- Bachelor's Degree or Higher (% of Over 25) by Zip Code (ZCTA5) — San Antonio Metro
- Household Average Size by Zip Code (ZCTA5) — San Antonio Metro
- Married Couple (% of all Households) by Zip Code (ZCTA5) — San Antonio Metro
- % of Population without Health Insurance, by Zip Code (ZCTA5) — San Antonio Metro
- Housing Vacancy Rate by Zip Code (ZCTA5) — San Antonio Metro
- Housing Owner-Occupied % of Units, by Zip Code (ZCTA5) — San Antonio Metro
- Housing Owner-Occupied Median Value ($), by Zip Code (ZCTA5) — San Antonio Metro
- Housing Median Monthly Rent ($), by Zip Code (ZCTA5) — San Antonio Metro
- High School Graduate (% of Over 25) by County
- U.S. Citizens (% of Population Over 18) by Zip Code (ZCTA5) — Texas
- Household Median Income by Zip Code (ZCTA5) — Texas
- Population Non-Hispanic Asian % by Zip Code (ZCTA5) — Chicago Metro
- Population Hispanic % by Zip Code (ZCTA5) — Texas
- Population Non-Hispanic American Indian % by Zip Code (ZCTA5) — Texas
- Median Age by Zip Code (ZCTA5) — Texas
- Population Non-Hispanic Black % by Zip Code (ZCTA5) — Texas
- High School Graduate (% of Over 25) by Zip Code (ZCTA5) — Texas
- % of Population on Food Stamps or SNAP (Last 12 Months), by Zip Code (ZCTA5) — Chicago Metro
- % of Households with Broadband Internet, by Zip Code (ZCTA5) — Baltimore Metro
- Bachelor's Degree or Higher (% of Over 25) by Zip Code (ZCTA5) — Baltimore Metro
- % of Population without Health Insurance, by Zip Code (ZCTA5) — Baltimore Metro
- Population Non-Hispanic Asian % by Zip Code (ZCTA5) — Charlotte Metro
- Population Non-Hispanic Asian % by Zip Code (ZCTA5) — Baltimore Metro
- % of Population on Food Stamps or SNAP (Last 12 Months), by Zip Code (ZCTA5) — Charlotte Metro
- Household Median Income by Zip Code (ZCTA5) — Baltimore Metro
- High School Graduate (% of Over 25) by Zip Code (ZCTA5) — Baltimore Metro
- Population Non-Hispanic Black % by Zip Code (ZCTA5) — Baltimore Metro
- Married Couple (% of all Households) by Zip Code (ZCTA5) — Austin Metro
- Housing % of Units Built Since 2010, by Zip Code (ZCTA5) — Houston Metro
- Housing % of Units Built Since 2010, by Zip Code (ZCTA5) — San Diego Metro
- Housing % of Units Built Since 2010, by Zip Code (ZCTA5) — Atlanta Metro
- Housing % of Units Built Since 2010, by Zip Code (ZCTA5) — Boston Metro
- Housing % of Units Built Since 2010, by Zip Code (ZCTA5) — Austin Metro
- Housing % of Units Built Since 2010, by Zip Code (ZCTA5) — Miami Metro
- Housing % of Units Built Since 2010, by Zip Code (ZCTA5) — Detroit Metro
- Housing % of Units Built Since 2010, by Zip Code (ZCTA5) — Tampa Metro
- Housing % of Units Built Since 2010, by Zip Code (ZCTA5) — San Francisco Metro
- Housing % of Units Built Since 2010, by Zip Code (ZCTA5) — Seattle Metro