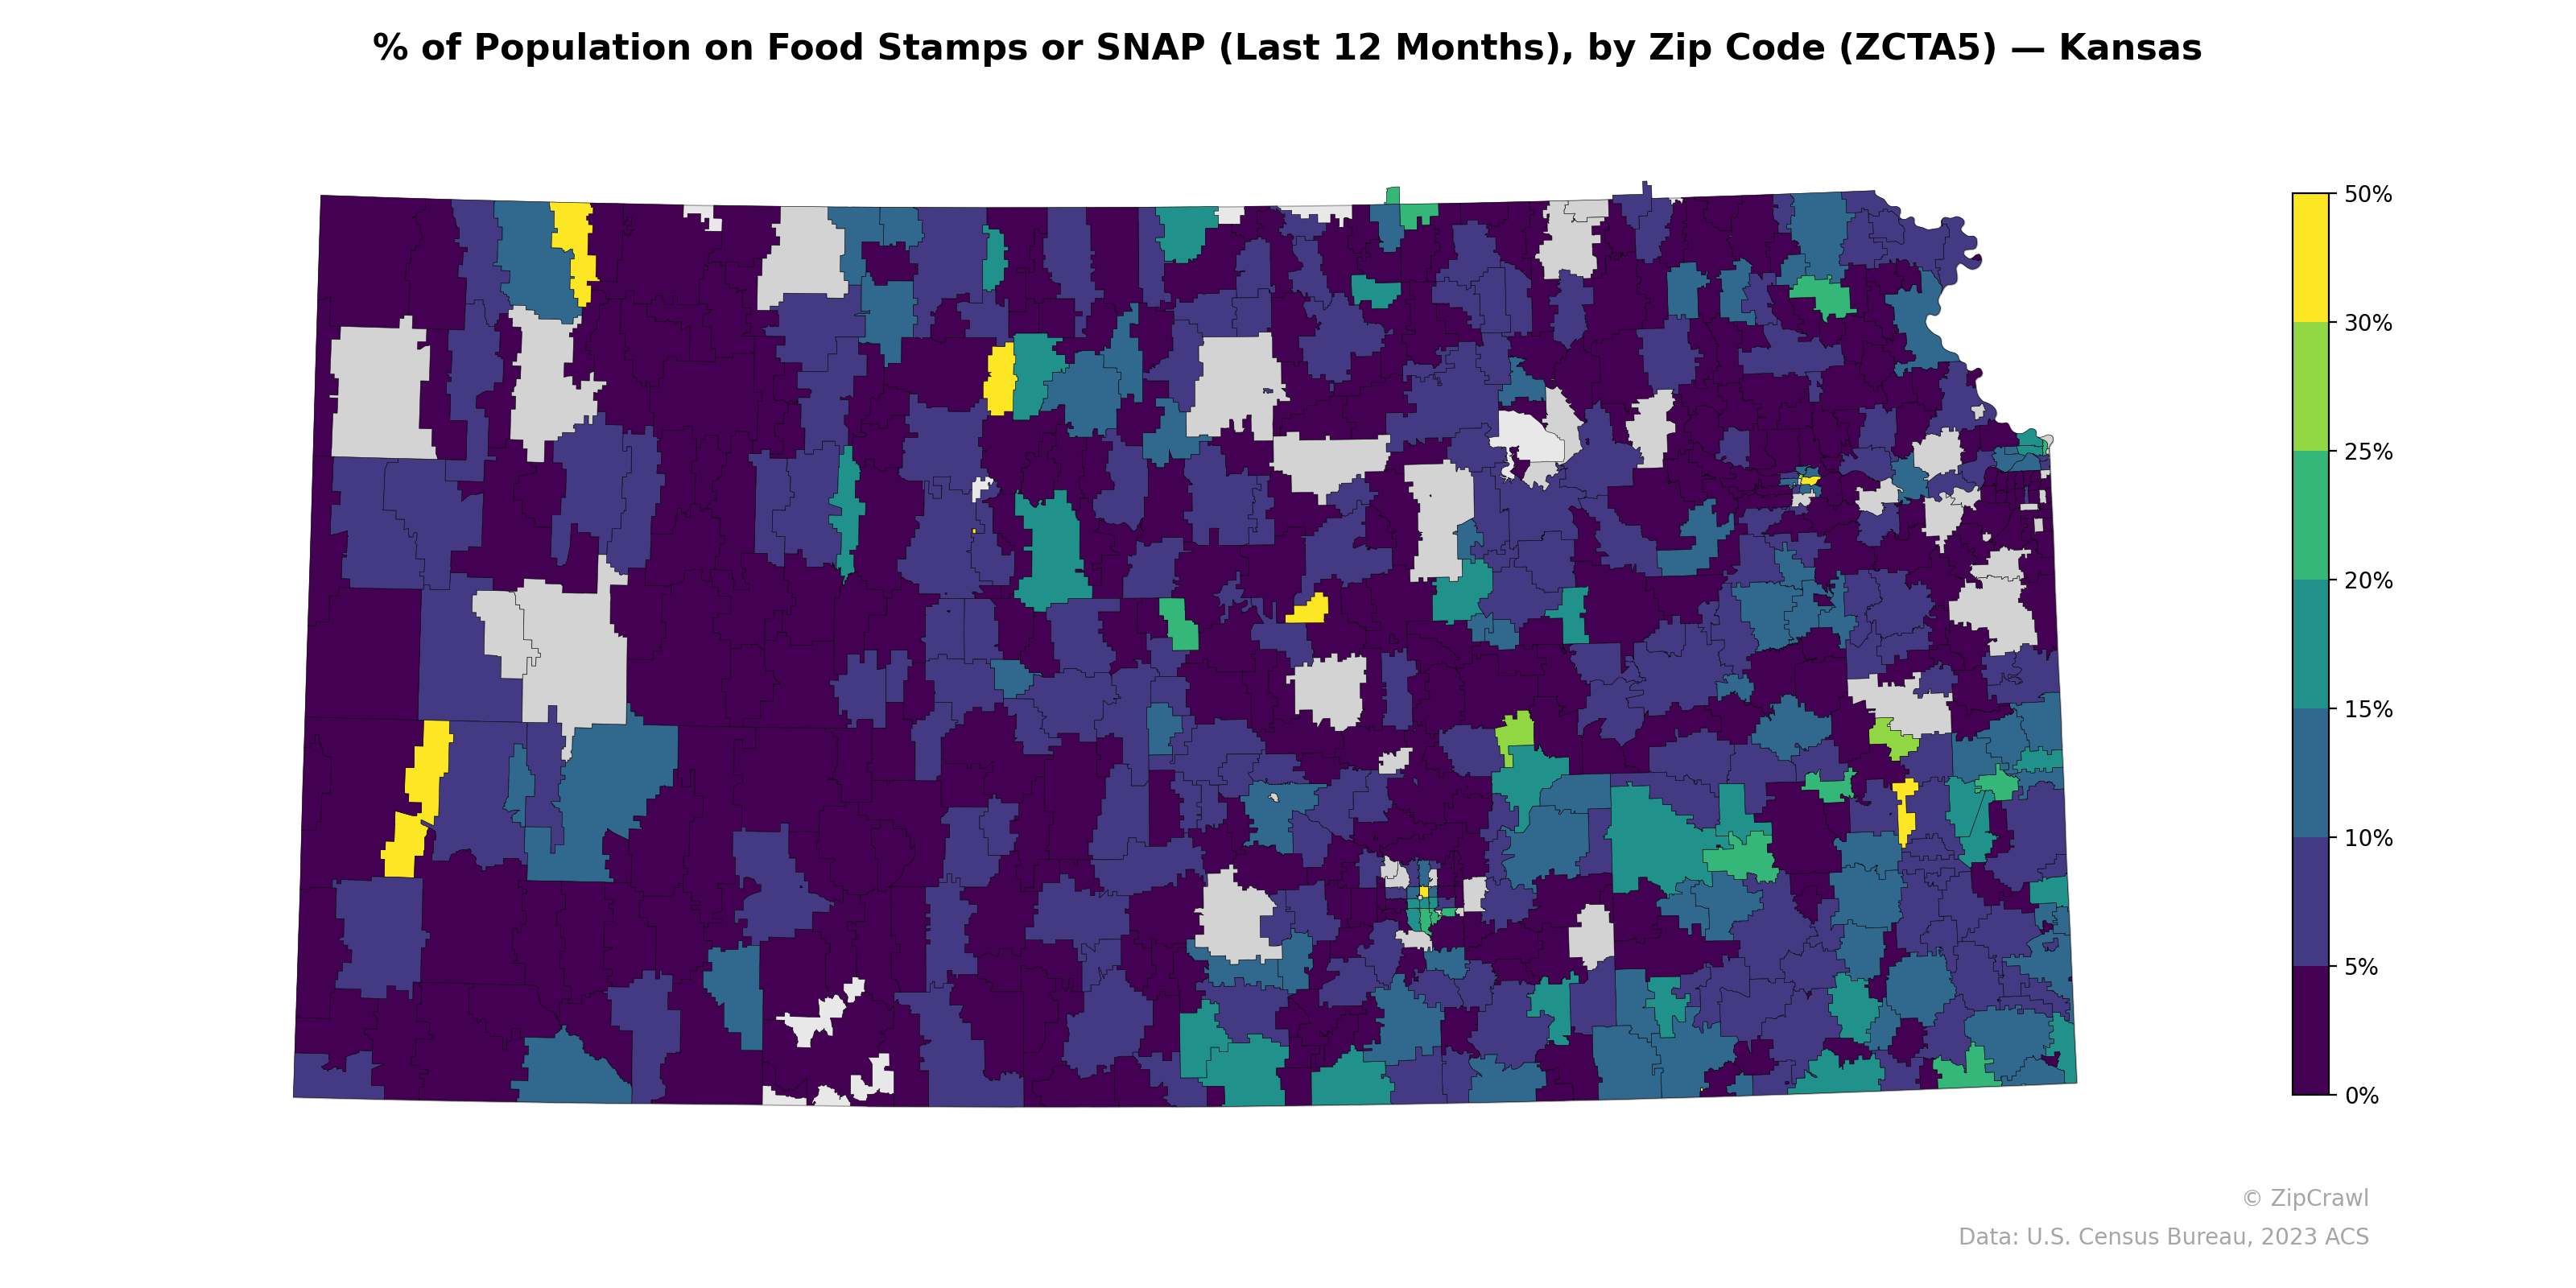
NOTE: Gray indicates insufficient data or a suppressed estimate.
Southeastern Kansas exhibits notably higher SNAP participation rates, with several zip codes in the 15–25% range forming a visible cluster, consistent with the region's historically higher poverty levels. The Kansas City metropolitan area in the northeast corner displays sharp intra-urban contrasts, with adjacent zip codes ranging from under 5% to over 25%, reflecting significant economic segregation within a small geographic area. Western Kansas is predominantly low-participation (under 10%), though scattered zip codes—particularly along the southwestern border and in a few isolated rural communities—show elevated rates above 30%, likely corresponding to small populations where a few households significantly shift the percentage.
Data: U.S. Census Bureau, 2023 ACS
Explore
- Housing Owner-Occupied % of Units, by Zip Code (ZCTA5) — Florida
- Population Non-Hispanic Black % by Zip Code (ZCTA5) — New Mexico
- Median Age by Zip Code (ZCTA5) — New Mexico
- Housing Vacancy Rate by Zip Code (ZCTA5) — Kansas
- Household Median Income by Zip Code (ZCTA5) — New Mexico
- Married Couple (% of all Households) by Zip Code (ZCTA5) — Kansas
- Population Hispanic % by Zip Code (ZCTA5) — New Mexico
- U.S. Citizens (% of Population Over 18) by Zip Code (ZCTA5) — New Mexico
- Population Non-Hispanic White % by Zip Code (ZCTA5) — New Mexico
- Population Non-Hispanic Asian % by Zip Code (ZCTA5) — Kansas
- Housing Median Monthly Rent ($), by County
- Household Average Size by Zip Code (ZCTA5) — Florida
- Housing Vacancy Rate by Zip Code (ZCTA5) — Florida
- Housing Owner-Occupied % of Units, by Zip Code (ZCTA5) — Michigan
- Married Couple (% of all Households) by Zip Code (ZCTA5) — Florida
- Housing Owner-Occupied Median Value ($), by Zip Code (ZCTA5) — Florida
- % of Population without Health Insurance, by Zip Code (ZCTA5) — Florida
- Housing Median Monthly Rent ($), by Zip Code (ZCTA5) — Florida
- Bachelor's Degree or Higher (% of Over 25) by Zip Code (ZCTA5) — Florida
- % of Households with Broadband Internet, by Zip Code (ZCTA5) — Florida
- Housing % of Units Built Since 2010, by Zip Code (ZCTA5) — Florida
- Population Non-Hispanic Asian % by Zip Code (ZCTA5) — Mississippi
- % of Households with Broadband Internet, by Zip Code (ZCTA5) — Mississippi
- U.S. Citizens (% of Population Over 18) by Zip Code (ZCTA5) — Kansas
- Median Age by Zip Code (ZCTA5) — Idaho
- % of Population without Health Insurance, by Zip Code (ZCTA5) — Mississippi
- High School Graduate (% of Over 25) by Zip Code (ZCTA5) — Mississippi
- Population Non-Hispanic American Indian % by Zip Code (ZCTA5) — Mississippi
- Bachelor's Degree or Higher (% of Over 25) by Zip Code (ZCTA5) — Mississippi
- Household Median Income by Zip Code (ZCTA5) — Kansas
- % of Population on Food Stamps or SNAP (Last 12 Months), by Zip Code (ZCTA5) — Arkansas
- % of Population on Food Stamps or SNAP (Last 12 Months), by Zip Code (ZCTA5) — Texas
- % of Population on Food Stamps or SNAP (Last 12 Months), by Zip Code (ZCTA5) — Ohio
- % of Population on Food Stamps or SNAP (Last 12 Months), by Zip Code (ZCTA5) — Oregon
- % of Population on Food Stamps or SNAP (Last 12 Months), by Zip Code (ZCTA5) — Montana
- % of Population on Food Stamps or SNAP (Last 12 Months), by Zip Code (ZCTA5) — Iowa
- % of Population on Food Stamps or SNAP (Last 12 Months), by Zip Code (ZCTA5) — Maine
- % of Population on Food Stamps or SNAP (Last 12 Months), by Zip Code (ZCTA5) — Utah
- % of Population on Food Stamps or SNAP (Last 12 Months), by Zip Code (ZCTA5) — Idaho
- % of Population on Food Stamps or SNAP (Last 12 Months), by Zip Code (ZCTA5) — Alaska