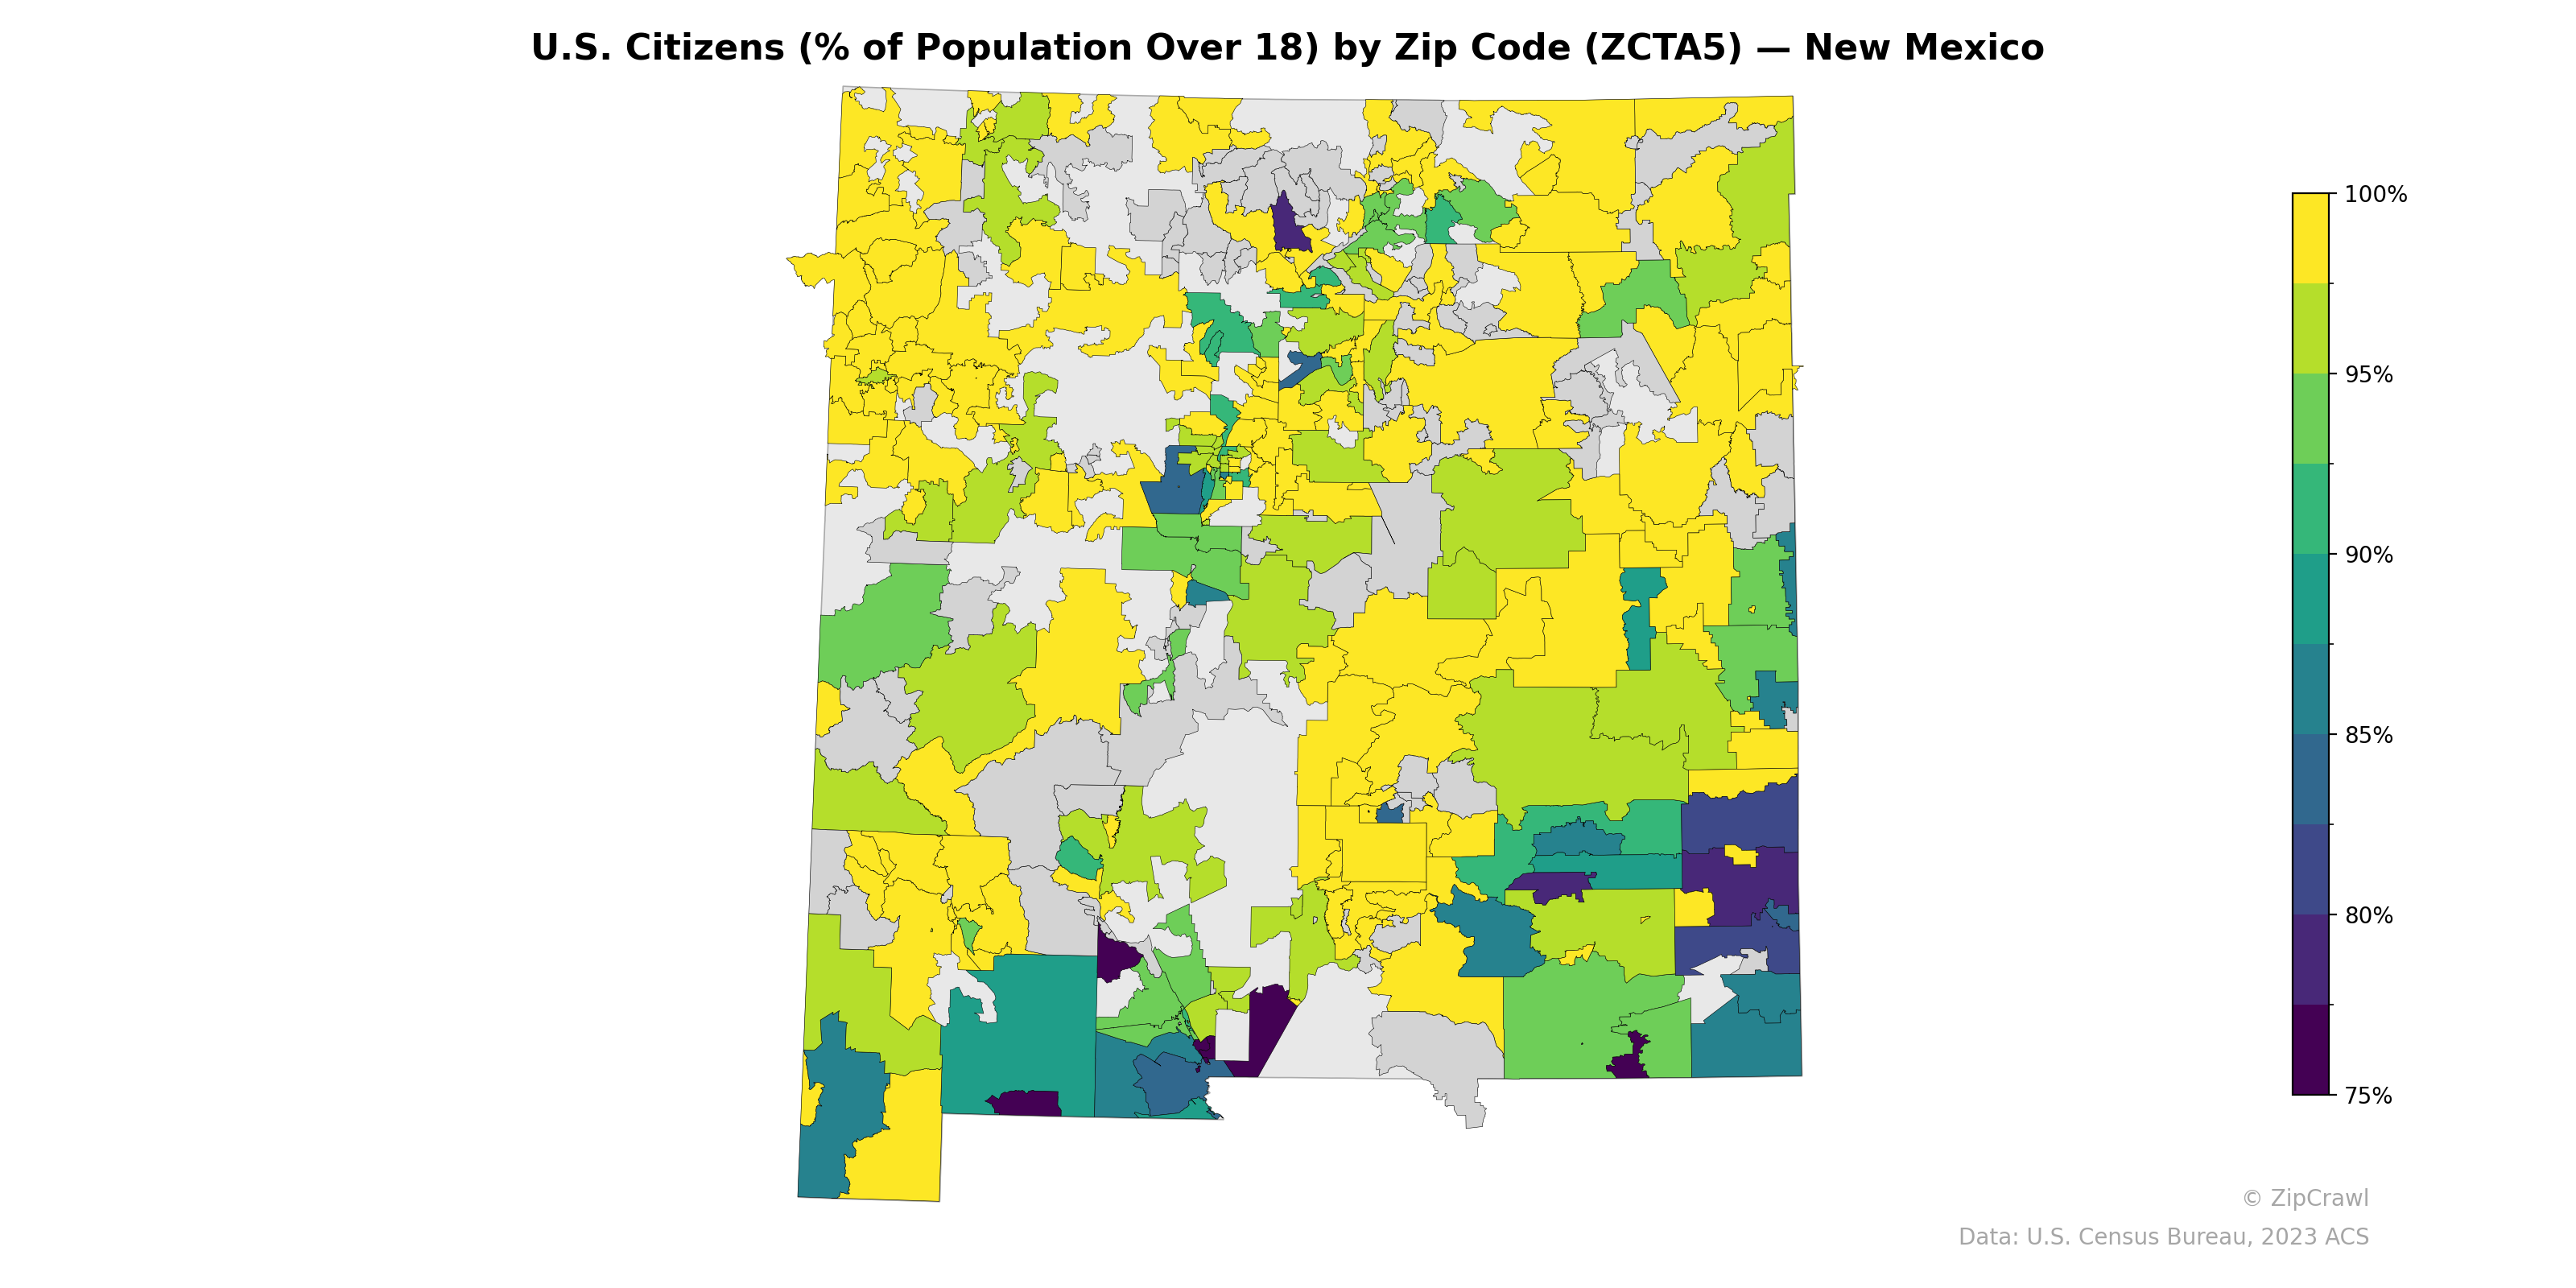
NOTE: Gray indicates insufficient data or a suppressed estimate.
The southern border region of New Mexico, particularly in the southeast near the Texas border and along the Mexican border, exhibits notably lower U.S. citizenship rates among the adult population, with several zip codes falling below 80%. In contrast, the northwestern and north-central portions of the state—including areas around Native American reservations and rural communities—consistently display citizenship rates at or near 100%. The Albuquerque metropolitan area in the central part of the state presents a mixed pattern, with some zip codes dipping into the 85–90% range while surrounding suburban and exurban areas trend higher.
Data: U.S. Census Bureau, 2023 ACS
Explore
- Housing Owner-Occupied % of Units, by Zip Code (ZCTA5) — Florida
- Housing Owner-Occupied Median Value ($), by Zip Code (ZCTA5) — Florida
- Population Non-Hispanic Black % by Zip Code (ZCTA5) — New Mexico
- Housing Vacancy Rate by Zip Code (ZCTA5) — Kansas
- Married Couple (% of all Households) by Zip Code (ZCTA5) — Kansas
- Population Hispanic % by Zip Code (ZCTA5) — New Mexico
- Population Non-Hispanic White % by Zip Code (ZCTA5) — New Mexico
- % of Population on Food Stamps or SNAP (Last 12 Months), by Zip Code (ZCTA5) — Kansas
- Median Age by Zip Code (ZCTA5) — New Mexico
- Household Median Income by Zip Code (ZCTA5) — New Mexico
- Population Non-Hispanic Asian % by Zip Code (ZCTA5) — Kansas
- Housing Median Monthly Rent ($), by County
- Housing Owner-Occupied Median Value ($), by Zip Code (ZCTA5) — Michigan
- Married Couple (% of all Households) by Zip Code (ZCTA5) — Florida
- Housing Vacancy Rate by Zip Code (ZCTA5) — Florida
- Housing Median Monthly Rent ($), by Zip Code (ZCTA5) — Florida
- Housing % of Units Built Since 2010, by Zip Code (ZCTA5) — Florida
- Bachelor's Degree or Higher (% of Over 25) by Zip Code (ZCTA5) — Florida
- % of Households with Broadband Internet, by Zip Code (ZCTA5) — Florida
- % of Population without Health Insurance, by Zip Code (ZCTA5) — Florida
- Household Average Size by Zip Code (ZCTA5) — Florida
- Population Non-Hispanic Asian % by Zip Code (ZCTA5) — Mississippi
- % of Population without Health Insurance, by Zip Code (ZCTA5) — Mississippi
- % of Population on Food Stamps or SNAP (Last 12 Months), by Zip Code (ZCTA5) — Mississippi
- Median Age by Zip Code (ZCTA5) — Idaho
- Population Non-Hispanic American Indian % by Zip Code (ZCTA5) — Mississippi
- Bachelor's Degree or Higher (% of Over 25) by Zip Code (ZCTA5) — Mississippi
- High School Graduate (% of Over 25) by Zip Code (ZCTA5) — Mississippi
- % of Households with Broadband Internet, by Zip Code (ZCTA5) — Mississippi
- Housing Owner-Occupied % of Units, by Zip Code (ZCTA5) — Mississippi
- U.S. Citizens (% of Population Over 18) by Zip Code (ZCTA5) — New York
- U.S. Citizens (% of Population Over 18) by Zip Code (ZCTA5) — New York Metro
- U.S. Citizens (% of Population Over 18) by Zip Code (ZCTA5) — New Jersey
- U.S. Citizens (% of Population Over 18) by Zip Code (ZCTA5) — Nevada
- U.S. Citizens (% of Population Over 18) by Zip Code (ZCTA5) — Maine
- U.S. Citizens (% of Population Over 18) by Zip Code (ZCTA5) — Utah
- U.S. Citizens (% of Population Over 18) by Zip Code (ZCTA5) — Ohio
- U.S. Citizens (% of Population Over 18) by Zip Code (ZCTA5) — Nebraska
- U.S. Citizens (% of Population Over 18) by Zip Code (ZCTA5) — New Hampshire
- U.S. Citizens (% of Population Over 18) by Zip Code (ZCTA5) — Oregon