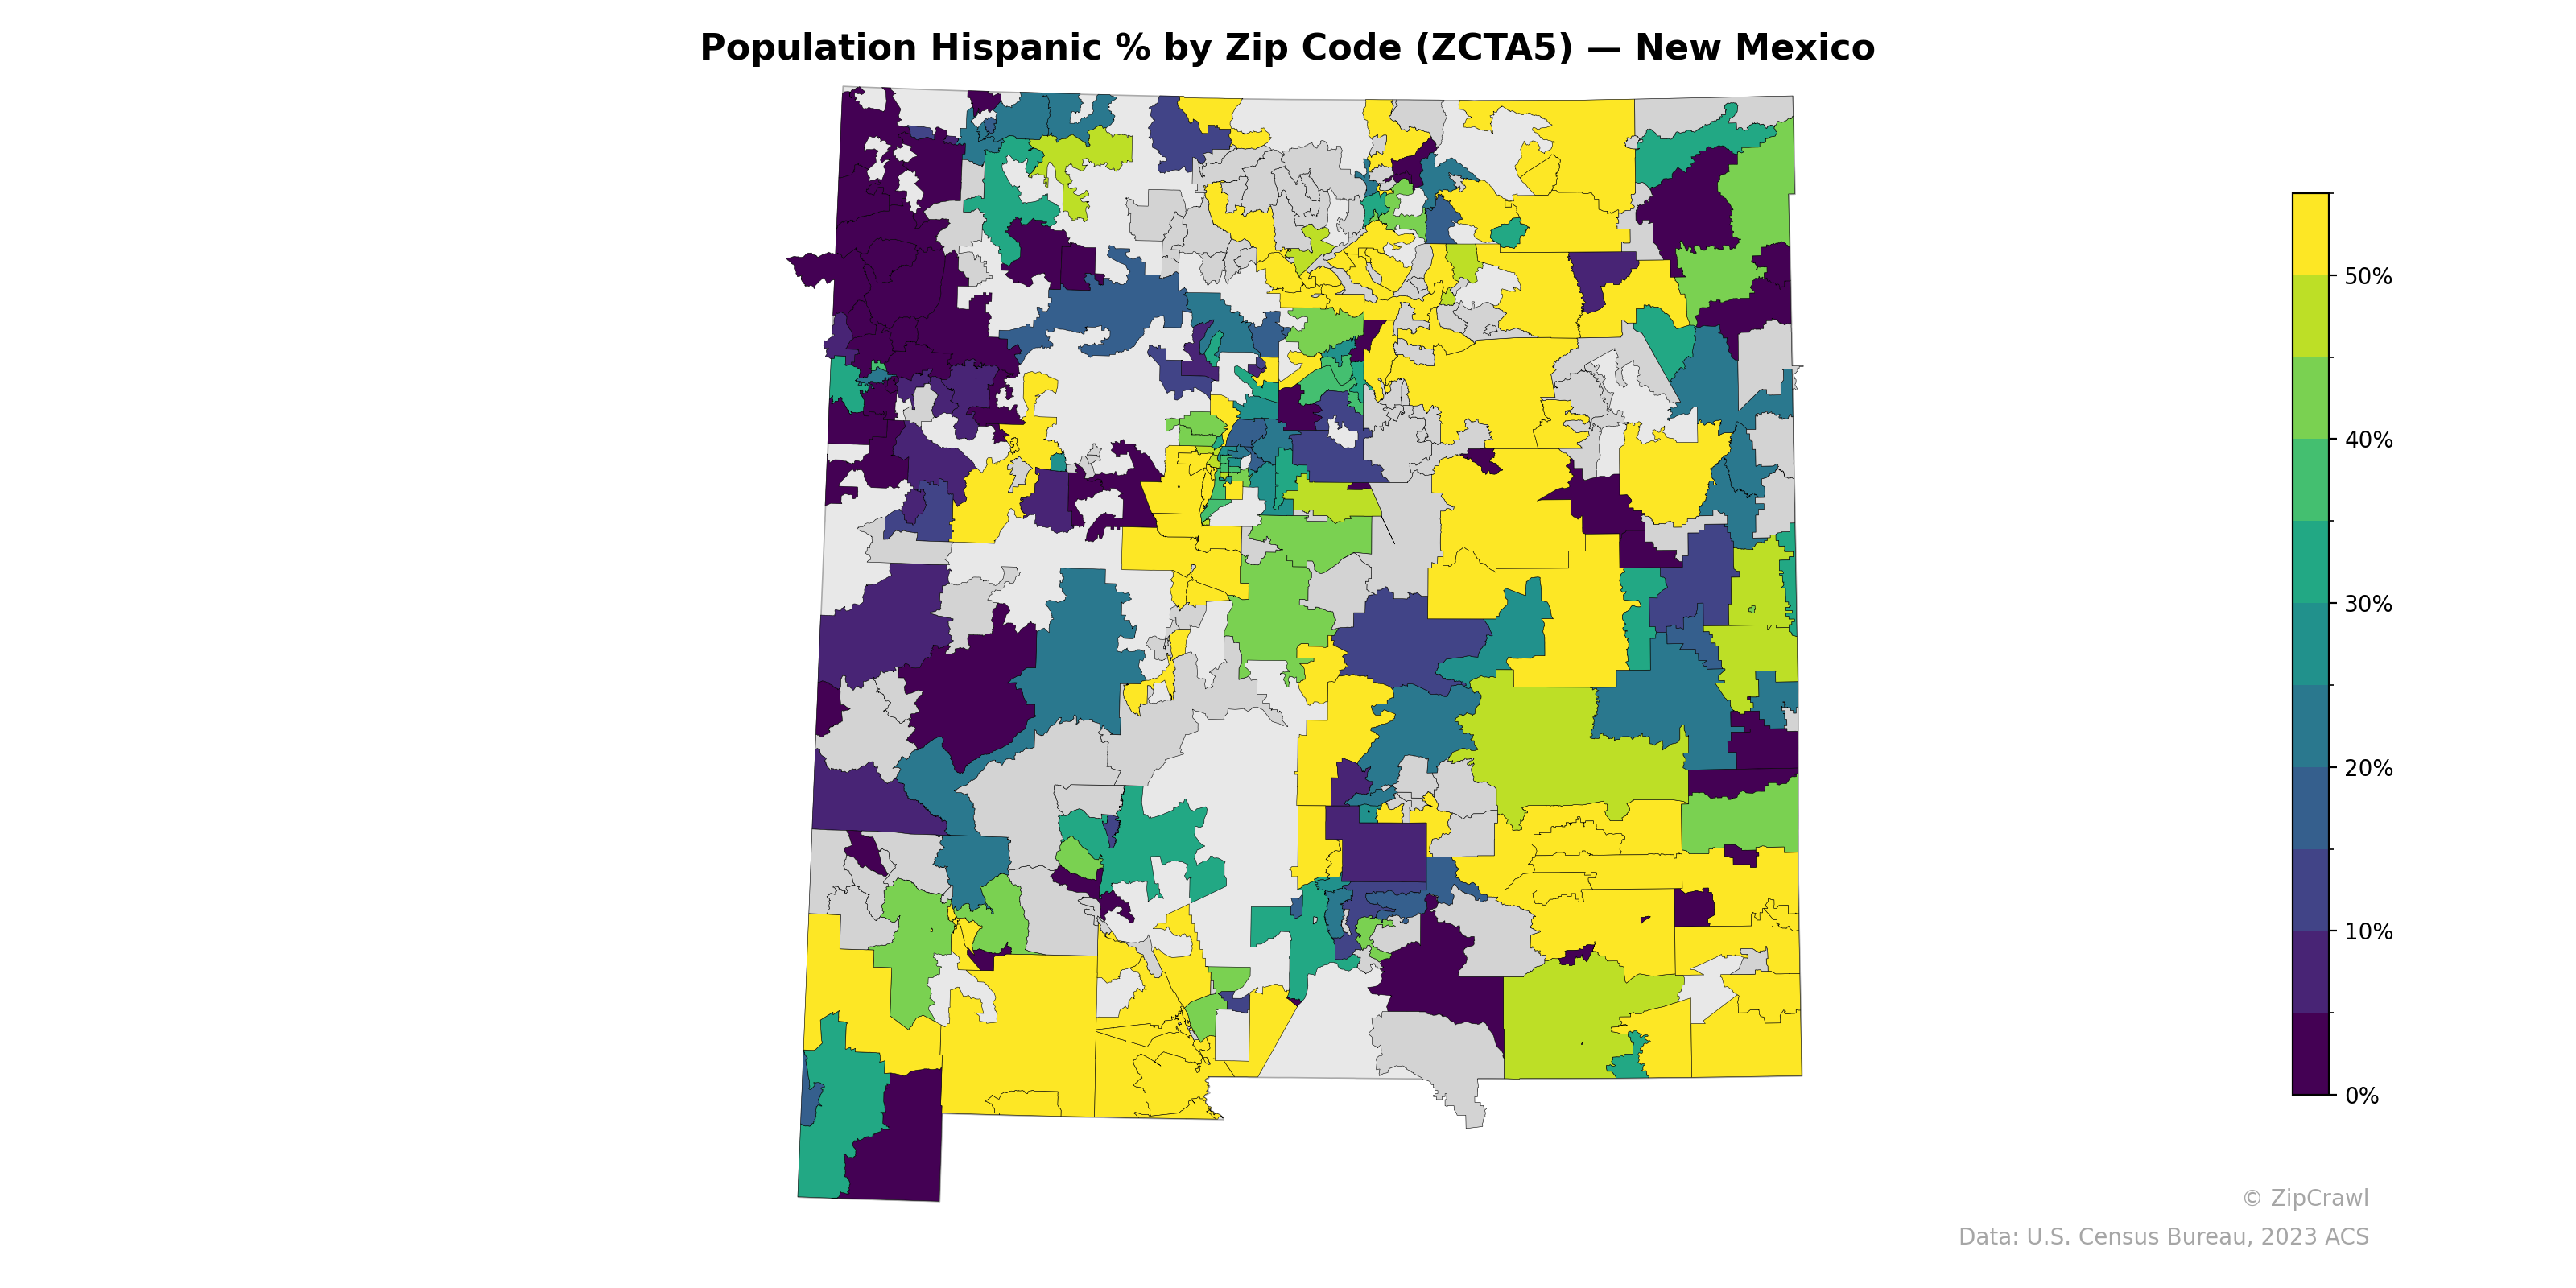
NOTE: Gray indicates insufficient data or a suppressed estimate.
Hispanic population percentages across New Mexico's zip codes display striking geographic variation, with the highest concentrations (50%+) clustering along the southern border region, the Rio Grande corridor, and portions of the northeast, while the lowest percentages (under 10%) appear predominantly in the northwest—areas largely corresponding to Navajo Nation and other tribal lands. The Albuquerque metro area exhibits a patchwork of moderate-to-high Hispanic percentages, contrasting with the more uniformly low values in the Four Corners region and parts of the central-west. This spatial pattern reflects the historical settlement of Hispano communities along river valleys and in southern border counties, distinct from the Indigenous-majority populations in the northwest quadrant of the state.
Data: U.S. Census Bureau, 2023 ACS
Explore
- Married Couple (% of all Households) by Zip Code (ZCTA5) — Florida
- Housing Owner-Occupied % of Units, by Zip Code (ZCTA5) — Florida
- % of Population on Food Stamps or SNAP (Last 12 Months), by Zip Code (ZCTA5) — Kansas
- Housing Vacancy Rate by Zip Code (ZCTA5) — Kansas
- Median Age by Zip Code (ZCTA5) — New Mexico
- Married Couple (% of all Households) by Zip Code (ZCTA5) — Kansas
- Population Non-Hispanic Black % by Zip Code (ZCTA5) — New Mexico
- Population Non-Hispanic Asian % by Zip Code (ZCTA5) — Kansas
- Population Non-Hispanic White % by Zip Code (ZCTA5) — New Mexico
- U.S. Citizens (% of Population Over 18) by Zip Code (ZCTA5) — New Mexico
- Household Median Income by Zip Code (ZCTA5) — New Mexico
- Housing Median Monthly Rent ($), by County
- Housing Vacancy Rate by Zip Code (ZCTA5) — Florida
- Married Couple (% of all Households) by Zip Code (ZCTA5) — Michigan
- Housing % of Units Built Since 2010, by Zip Code (ZCTA5) — Florida
- Household Average Size by Zip Code (ZCTA5) — Florida
- % of Population without Health Insurance, by Zip Code (ZCTA5) — Florida
- Housing Owner-Occupied Median Value ($), by Zip Code (ZCTA5) — Florida
- Bachelor's Degree or Higher (% of Over 25) by Zip Code (ZCTA5) — Florida
- % of Households with Broadband Internet, by Zip Code (ZCTA5) — Florida
- Housing Median Monthly Rent ($), by Zip Code (ZCTA5) — Florida
- Population Non-Hispanic Asian % by Zip Code (ZCTA5) — Mississippi
- % of Households with Broadband Internet, by Zip Code (ZCTA5) — Mississippi
- % of Population on Food Stamps or SNAP (Last 12 Months), by Zip Code (ZCTA5) — Mississippi
- % of Population without Health Insurance, by Zip Code (ZCTA5) — Mississippi
- U.S. Citizens (% of Population Over 18) by Zip Code (ZCTA5) — Kansas
- High School Graduate (% of Over 25) by Zip Code (ZCTA5) — Mississippi
- Population Non-Hispanic American Indian % by Zip Code (ZCTA5) — Mississippi
- Bachelor's Degree or Higher (% of Over 25) by Zip Code (ZCTA5) — Mississippi
- Household Average Size by Zip Code (ZCTA5) — Mississippi
- Population Hispanic % by Zip Code (ZCTA5) — New York
- Population Hispanic % by Zip Code (ZCTA5) — New York Metro
- Population Hispanic % by Zip Code (ZCTA5) — New Jersey
- Population Hispanic % by Zip Code (ZCTA5) — Nevada
- Population Hispanic % by Zip Code (ZCTA5) — New Hampshire
- Population Hispanic % by Zip Code (ZCTA5) — Maine
- Population Hispanic % by Zip Code (ZCTA5) — Nebraska
- Population Hispanic % by Zip Code (ZCTA5) — Iowa
- Population Hispanic % by Zip Code (ZCTA5) — Ohio
- Population Hispanic % by Zip Code (ZCTA5) — Utah