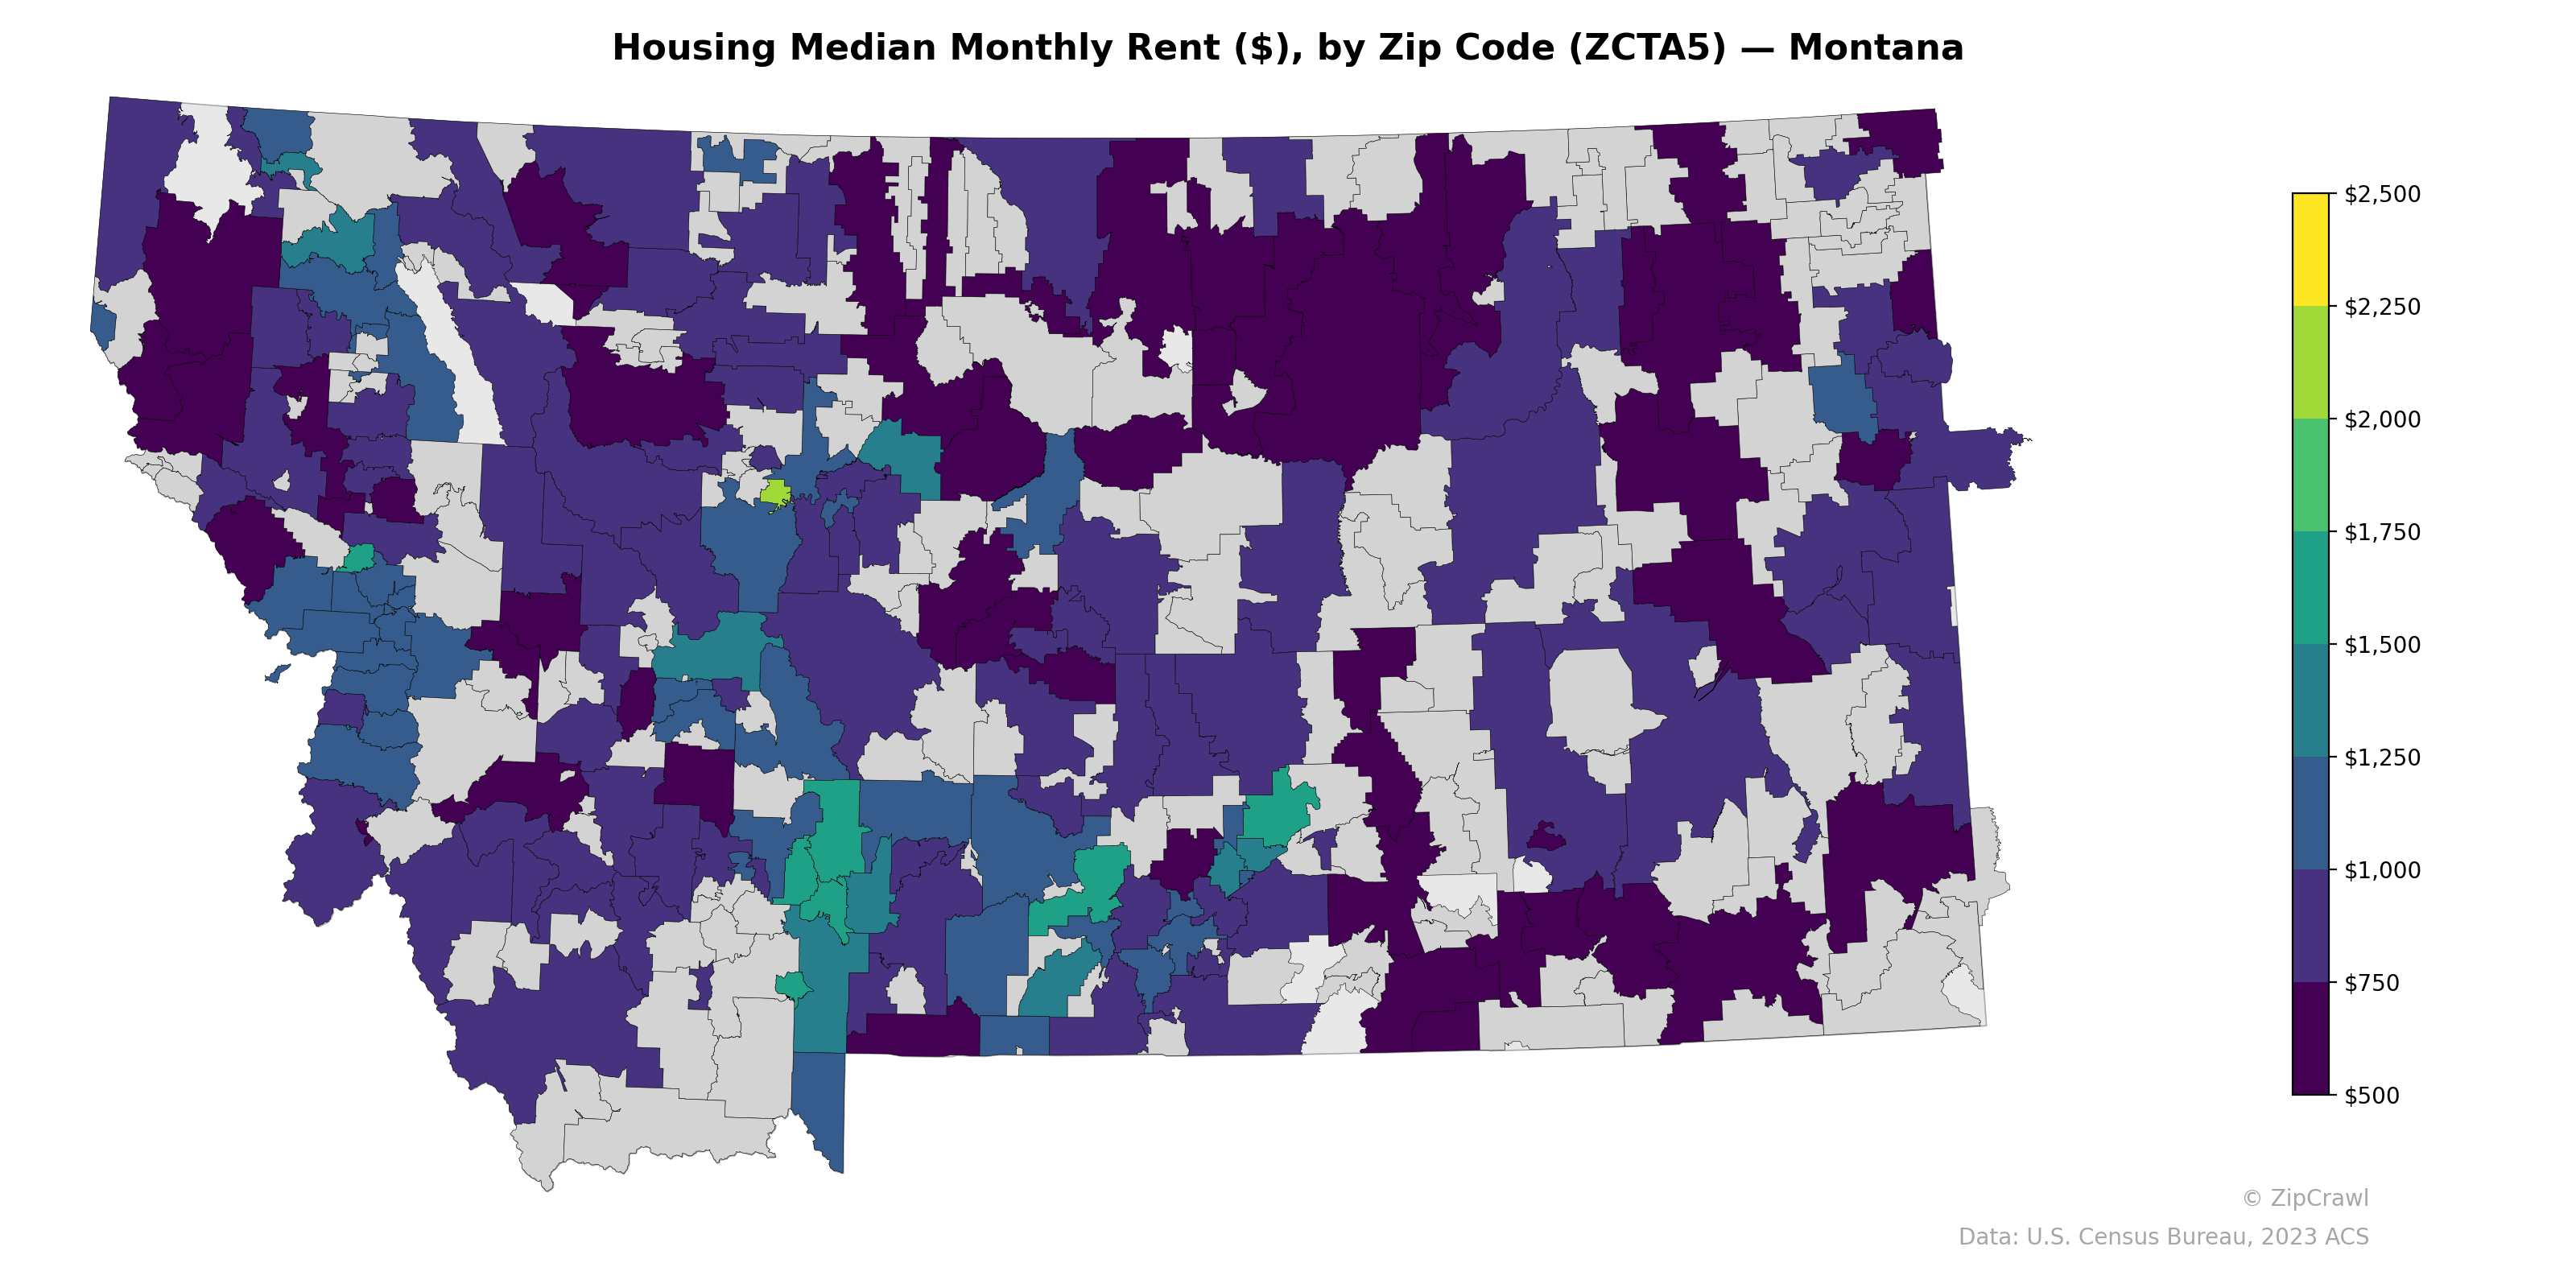
NOTE: Gray indicates insufficient data or a suppressed estimate.
Median monthly rents across Montana exhibit a clear west-east gradient, with the highest rents concentrated in the northwestern and west-central regions—particularly around the Flathead Valley, Missoula, and Bozeman corridors—where several zip codes reach $1,500 to $2,500+. Eastern Montana is dominated by lower rent levels in the $500–$750 range, with extensive gray (no data) areas reflecting sparse population and limited rental markets. Notable pockets of moderate rent ($1,000–$1,500) appear around Billings in the south-central part of the state and Great Falls in the north-central region, forming secondary clusters amid otherwise lower-cost surrounding areas.
Data: U.S. Census Bureau, 2023 ACS
Explore
- Population Non-Hispanic American Indian % by Zip Code (ZCTA5) — New York
- Housing % of Units Built Since 2010, by Zip Code (ZCTA5) — Montana
- Housing Owner-Occupied % of Units, by Zip Code (ZCTA5) — Montana
- % of Households with Broadband Internet, by Zip Code (ZCTA5) — Montana
- Population Non-Hispanic American Indian % by Zip Code (ZCTA5) — Montana
- Household Average Size by Zip Code (ZCTA5) — Montana
- Housing Owner-Occupied Median Value ($), by Zip Code (ZCTA5) — Montana
- % of Population without Health Insurance, by Zip Code (ZCTA5) — Montana
- High School Graduate (% of Over 25) by Zip Code (ZCTA5) — Montana
- Bachelor's Degree or Higher (% of Over 25) by Zip Code (ZCTA5) — Montana
- U.S. Citizens by County (% of Population Over 18)
- High School Graduate (% of Over 25) by Zip Code (ZCTA5) — New York
- Population Non-Hispanic Black % by Zip Code (ZCTA5) — New York
- Population Non-Hispanic Black % by Zip Code (ZCTA5) — Arizona
- Household Median Income by Zip Code (ZCTA5) — New York
- % of Population on Food Stamps or SNAP (Last 12 Months), by Zip Code (ZCTA5) — Florida
- Median Age by Zip Code (ZCTA5) — New York
- Population Non-Hispanic Black % by Zip Code (ZCTA5) — Pennsylvania
- Population Hispanic % by Zip Code (ZCTA5) — New York
- Population Non-Hispanic Asian % by Zip Code (ZCTA5) — Florida
- Population Non-Hispanic White % by Zip Code (ZCTA5) — New York
- U.S. Citizens (% of Population Over 18) by Zip Code (ZCTA5) — New York
- Housing Vacancy Rate by Zip Code (ZCTA5) — West Virginia
- % of Households with Broadband Internet, by Zip Code (ZCTA5) — West Virginia
- Population Non-Hispanic Asian % by Zip Code (ZCTA5) — West Virginia
- Population Hispanic % by Zip Code (ZCTA5) — Hawaii
- High School Graduate (% of Over 25) by Zip Code (ZCTA5) — West Virginia
- Population Non-Hispanic American Indian % by Zip Code (ZCTA5) — West Virginia
- Bachelor's Degree or Higher (% of Over 25) by Zip Code (ZCTA5) — West Virginia
- % of Population without Health Insurance, by Zip Code (ZCTA5) — West Virginia
- Housing Median Monthly Rent ($), by Zip Code (ZCTA5) — Indiana
- Housing Median Monthly Rent ($), by Zip Code (ZCTA5) — Louisiana
- Housing Median Monthly Rent ($), by Zip Code (ZCTA5) — Ohio
- Housing Median Monthly Rent ($), by Zip Code (ZCTA5) — Iowa
- Housing Median Monthly Rent ($), by Zip Code (ZCTA5) — Maine
- Housing Median Monthly Rent ($), by Zip Code (ZCTA5) — Vermont
- Housing Median Monthly Rent ($), by Zip Code (ZCTA5) — Utah
- Housing Median Monthly Rent ($), by Zip Code (ZCTA5) — Arizona
- Housing Median Monthly Rent ($), by Zip Code (ZCTA5) — Hawaii
- Housing Median Monthly Rent ($), by Zip Code (ZCTA5) — Texas