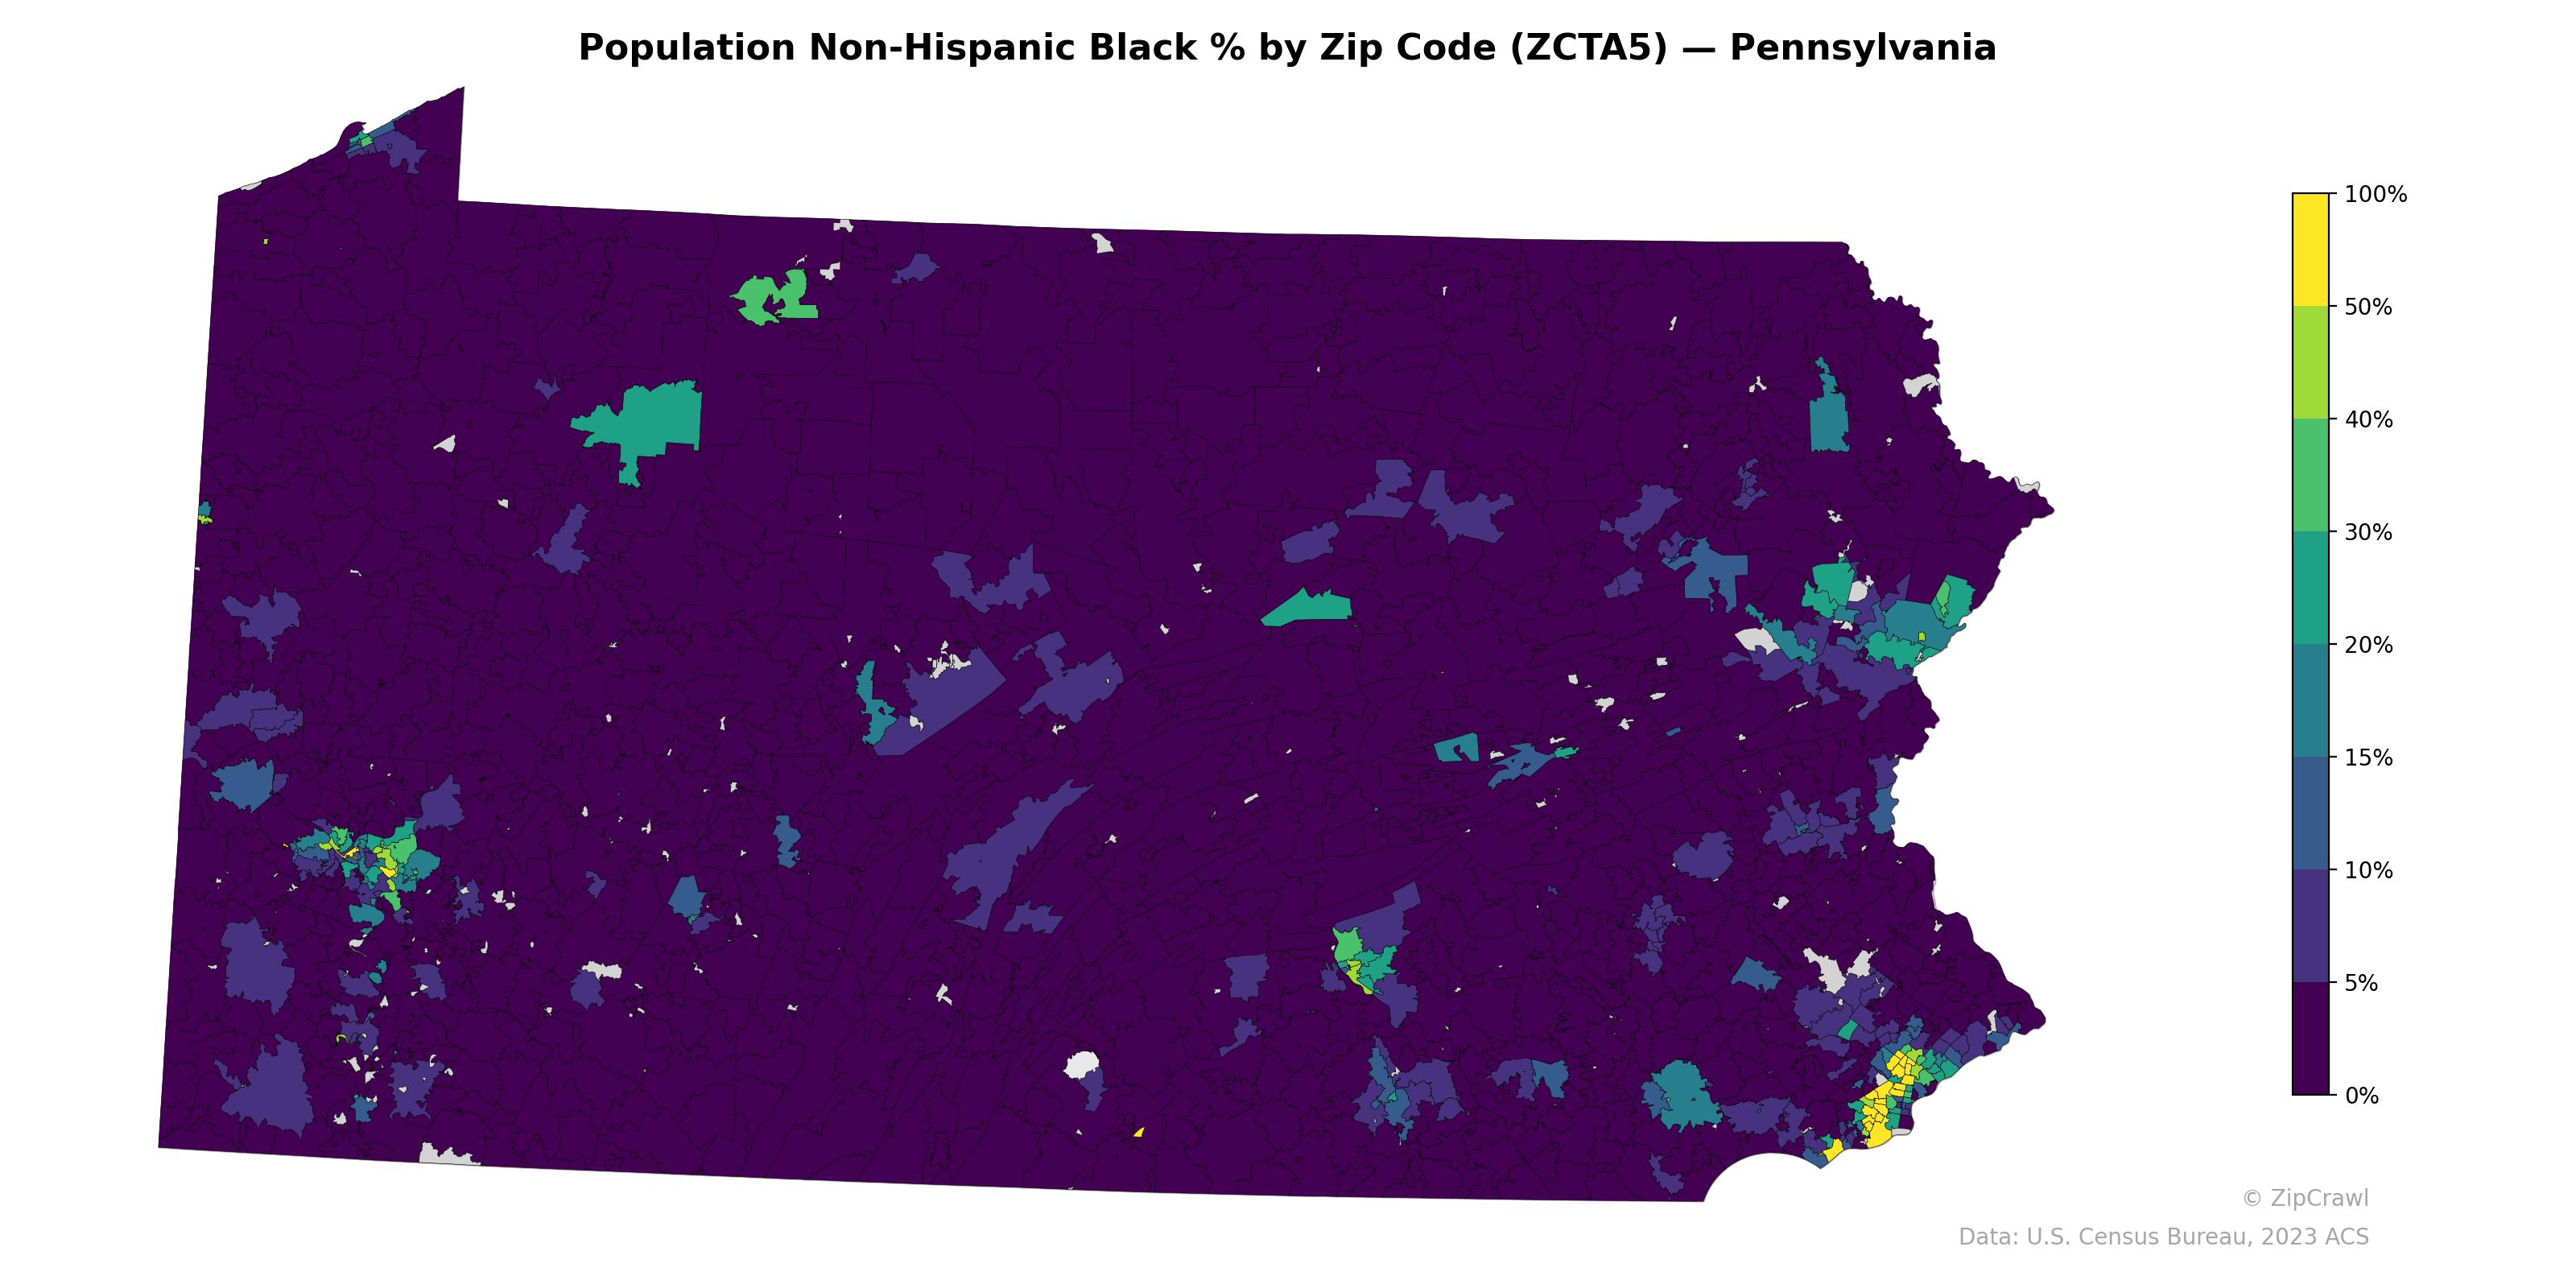
NOTE: Gray indicates insufficient data or a suppressed estimate.
The highest concentrations of Non-Hispanic Black residents in Pennsylvania cluster in the southeastern corner around Philadelphia, where several zip codes exceed 50%, and in the southwestern Pittsburgh metro area, where pockets reach approximately 20–40%. Mid-sized urban centers such as Harrisburg, Erie, and areas in the Lehigh Valley display moderate percentages in the 10–25% range, forming smaller but distinct nodes against the surrounding rural landscape. The vast majority of central and northern Pennsylvania zip codes fall below 5%, underscoring a sharp urban-rural demographic divide across the state.
Data: U.S. Census Bureau, 2023 ACS
Explore
- Housing Median Monthly Rent ($), by Zip Code (ZCTA5) — Oklahoma
- Housing % of Units Built Since 2010, by County
- Population Non-Hispanic Asian % by Zip Code (ZCTA5) — Illinois
- Population Hispanic % by Zip Code (ZCTA5) — Pennsylvania
- Median Age by Zip Code (ZCTA5) — Pennsylvania
- Population Non-Hispanic White % by Zip Code (ZCTA5) — Pennsylvania
- U.S. Citizens (% of Population Over 18) by Zip Code (ZCTA5) — Pennsylvania
- Household Median Income by Zip Code (ZCTA5) — Pennsylvania
- High School Graduate (% of Over 25) by Zip Code (ZCTA5) — Pennsylvania
- Population Non-Hispanic American Indian % by Zip Code (ZCTA5) — Pennsylvania
- % of Population on Food Stamps or SNAP (Last 12 Months), by Zip Code (ZCTA5) — Illinois
- Housing Median Monthly Rent ($), by Zip Code (ZCTA5) — Alaska
- Housing Median Monthly Rent ($), by Zip Code (ZCTA5) — Arkansas
- Housing Median Monthly Rent ($), by Zip Code (ZCTA5) — Montana
- Housing Median Monthly Rent ($), by Zip Code (ZCTA5) — Idaho
- Household Median Income by County
- Married Couple (% of all Households) by County
- Household Average Size by County
- U.S. Citizens by County (% of Population Over 18)
- Housing Median Monthly Rent ($), by County
- Housing Owner-Occupied Median Value ($), by County
- Housing Owner-Occupied % of Units, by County
- % of Households with Broadband Internet, by County
- Housing Vacancy Rate by County
- Population Non-Hispanic Asian % by County
- Housing Owner-Occupied Median Value ($), by Zip Code (ZCTA5) — California
- % of Population without Health Insurance, by Zip Code (ZCTA5) — California
- Housing Owner-Occupied % of Units, by Zip Code (ZCTA5) — California
- Housing % of Units Built Since 2010, by Zip Code (ZCTA5) — California
- High School Graduate (% of Over 25) by Zip Code (ZCTA5) — California
- Population Non-Hispanic Black % by Zip Code (ZCTA5) — Virginia
- Population Non-Hispanic Black % by Zip Code (ZCTA5) — Ohio
- Population Non-Hispanic Black % by Zip Code (ZCTA5) — Utah
- Population Non-Hispanic Black % by Zip Code (ZCTA5) — Iowa
- Population Non-Hispanic Black % by Zip Code (ZCTA5) — California
- Population Non-Hispanic Black % by Zip Code (ZCTA5) — Georgia
- Population Non-Hispanic Black % by Zip Code (ZCTA5) — Oregon
- Population Non-Hispanic Black % by Zip Code (ZCTA5) — Texas
- Population Non-Hispanic Black % by Zip Code (ZCTA5) — Nevada
- Population Non-Hispanic Black % by Zip Code (ZCTA5) — Idaho