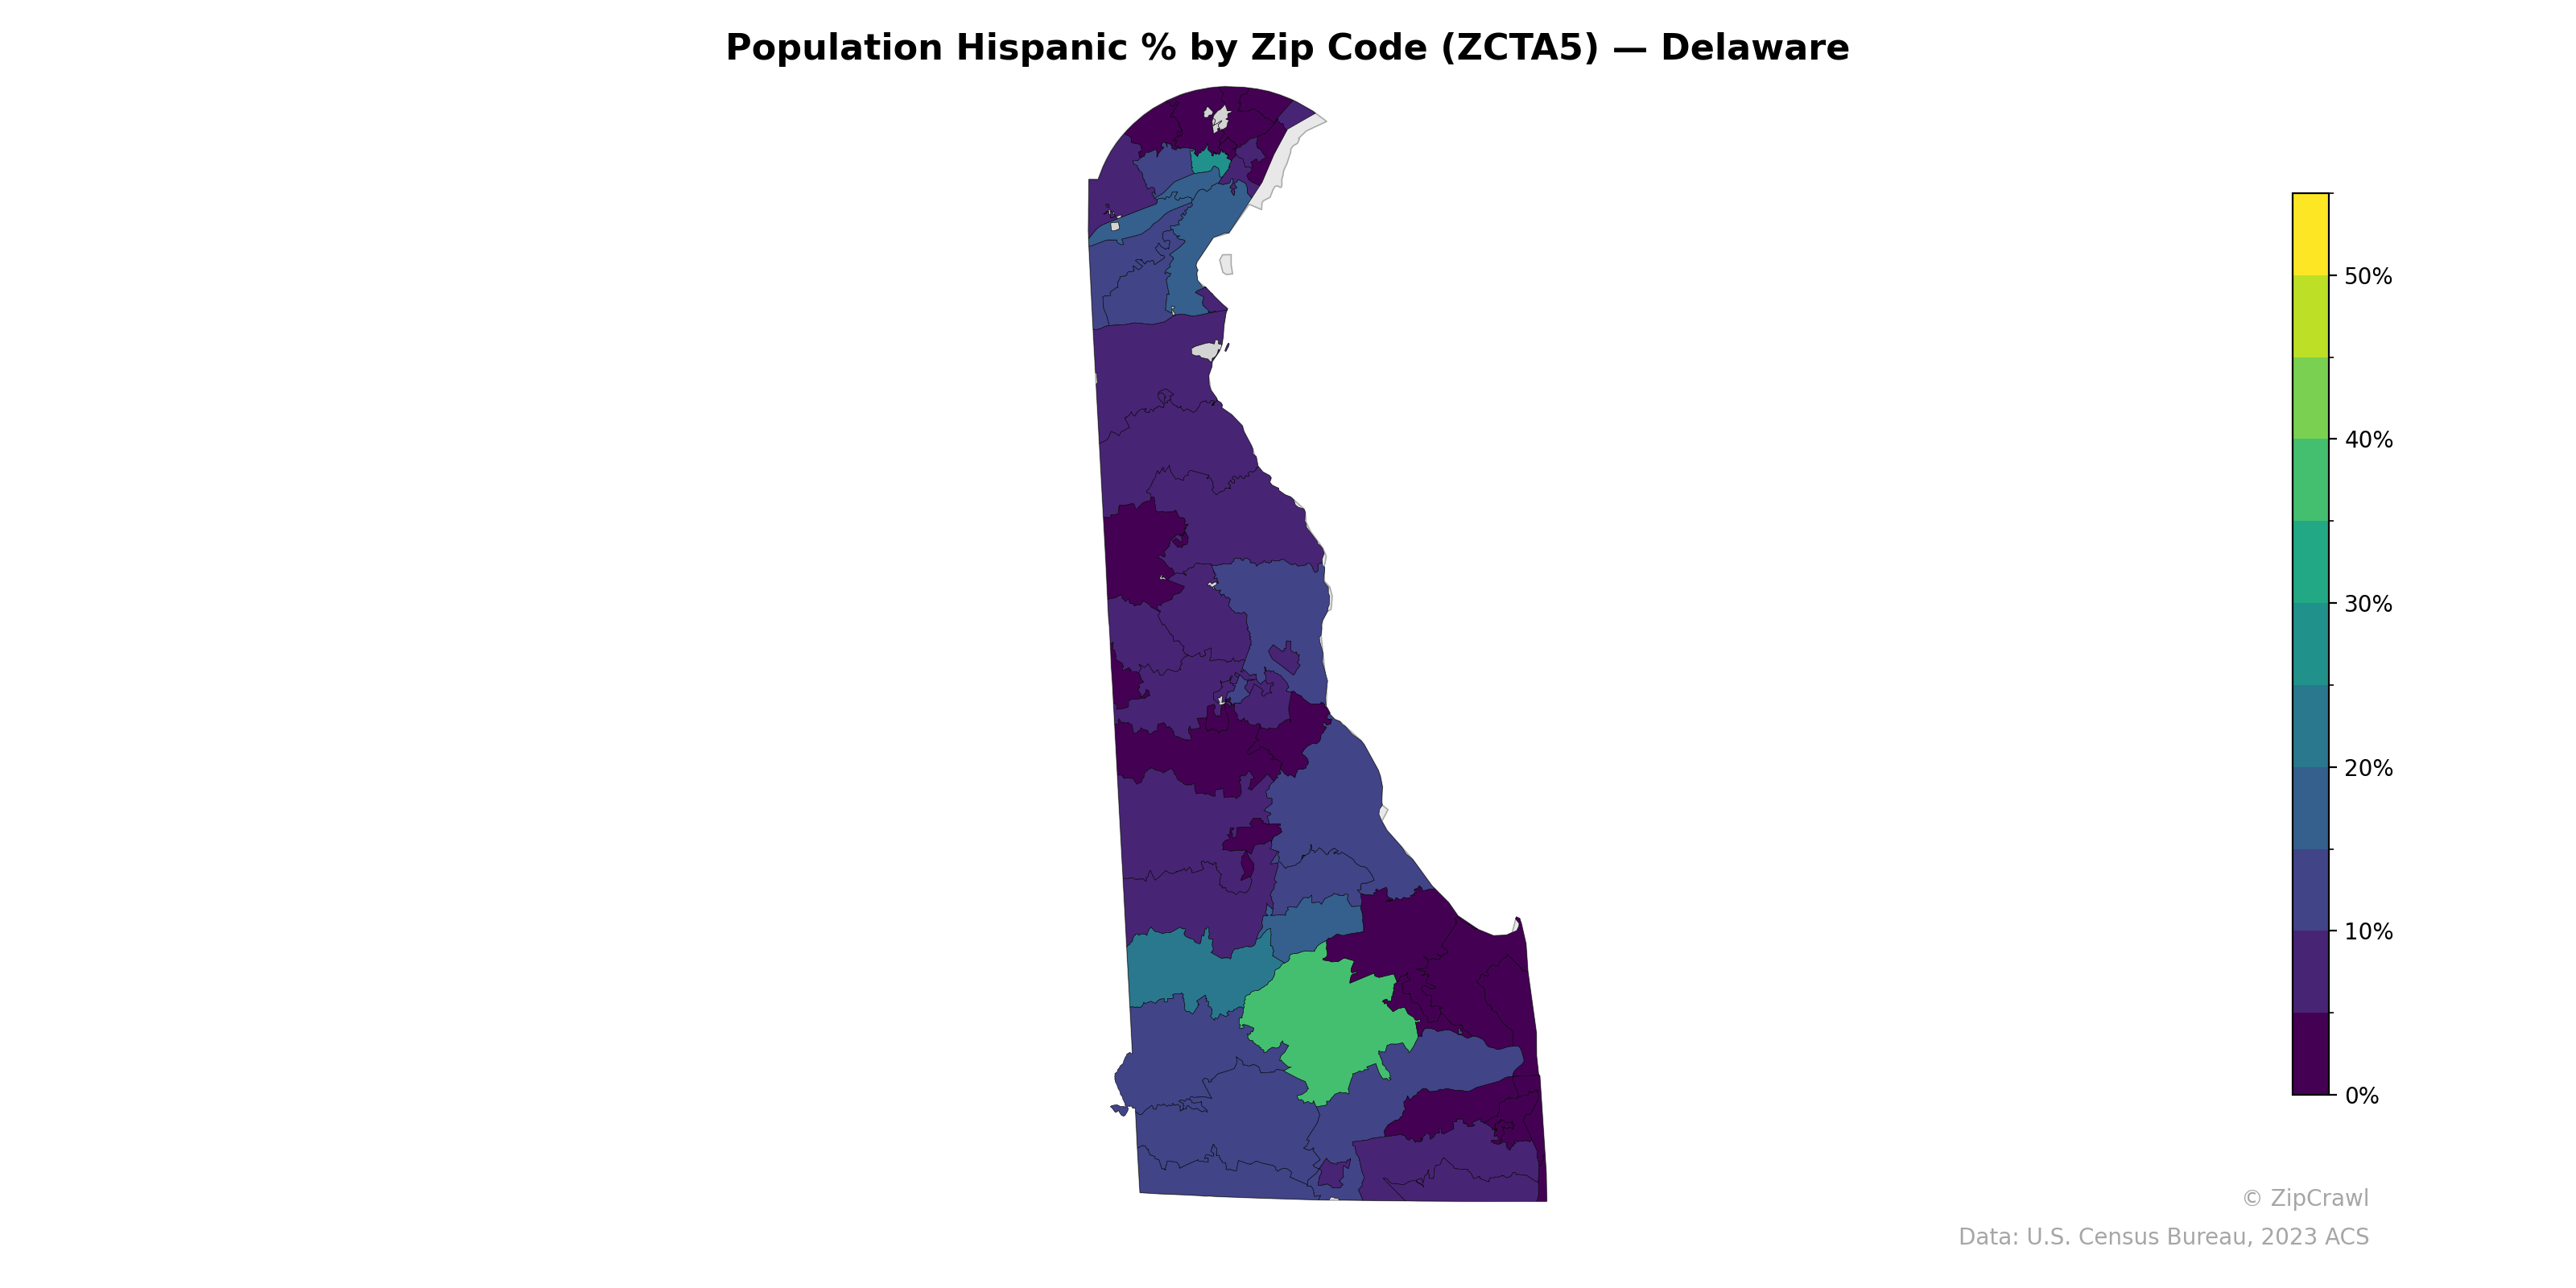
NOTE: Gray indicates insufficient data or a suppressed estimate.
Northern Delaware, particularly the Wilmington metro area, contains notable concentrations of Hispanic population, with several zip codes in the 15–30% range and at least one exceeding 40%, likely corresponding to the city of Wilmington itself. A distinct cluster in southern Sussex County, centered around the Georgetown-Milford corridor, reaches approximately 30–40% Hispanic population, reflecting the region's agricultural workforce demographics. The central portion of the state, spanning much of Kent County and rural northern Sussex County, generally maintains the lowest Hispanic percentages at under 5–10%, creating a clear contrast with both the northern urban core and the southern agricultural belt.
Data: U.S. Census Bureau, 2023 ACS
Explore
- % of Households with Broadband Internet, by Zip Code (ZCTA5) — New York
- Population Non-Hispanic Black % by Zip Code (ZCTA5) — Delaware
- U.S. Citizens (% of Population Over 18) by Zip Code (ZCTA5) — Delaware
- Median Age by Zip Code (ZCTA5) — Delaware
- Housing Vacancy Rate by Zip Code (ZCTA5) — Rhode Island
- Population Non-Hispanic White % by Zip Code (ZCTA5) — Delaware
- Population Non-Hispanic Asian % by Zip Code (ZCTA5) — Rhode Island
- Married Couple (% of all Households) by Zip Code (ZCTA5) — Rhode Island
- Household Median Income by Zip Code (ZCTA5) — Delaware
- % of Population on Food Stamps or SNAP (Last 12 Months), by Zip Code (ZCTA5) — Rhode Island
- Household Average Size by County
- Housing % of Units Built Since 2010, by County
- Married Couple (% of all Households) by Zip Code (ZCTA5) — New York
- Married Couple (% of all Households) by Zip Code (ZCTA5) — Tennessee
- Married Couple (% of all Households) by Zip Code (ZCTA5) — California
- Household Average Size by Zip Code (ZCTA5) — New York
- Housing Owner-Occupied Median Value ($), by Zip Code (ZCTA5) — New York
- % of Population without Health Insurance, by Zip Code (ZCTA5) — New York
- Housing Median Monthly Rent ($), by Zip Code (ZCTA5) — New York
- Housing % of Units Built Since 2010, by Zip Code (ZCTA5) — New York
- Housing Vacancy Rate by Zip Code (ZCTA5) — New York
- Housing Owner-Occupied % of Units, by Zip Code (ZCTA5) — New York
- Bachelor's Degree or Higher (% of Over 25) by Zip Code (ZCTA5) — New York
- High School Graduate (% of Over 25) by Zip Code (ZCTA5) — Rhode Island
- Population Non-Hispanic American Indian % by Zip Code (ZCTA5) — North Dakota
- Household Average Size by Zip Code (ZCTA5) — Rhode Island
- Bachelor's Degree or Higher (% of Over 25) by Zip Code (ZCTA5) — Rhode Island
- Housing Vacancy Rate by Zip Code (ZCTA5) — Alaska
- Population Non-Hispanic American Indian % by Zip Code (ZCTA5) — Rhode Island
- Population Non-Hispanic Black % by Zip Code (ZCTA5) — North Dakota
- Population Hispanic % by Zip Code (ZCTA5) — Hawaii
- Population Hispanic % by Zip Code (ZCTA5) — Utah
- Population Hispanic % by Zip Code (ZCTA5) — Ohio
- Population Hispanic % by Zip Code (ZCTA5) — Iowa
- Population Hispanic % by Zip Code (ZCTA5) — Texas
- Population Hispanic % by Zip Code (ZCTA5) — Oregon
- Population Hispanic % by Zip Code (ZCTA5) — Idaho
- Population Hispanic % by Zip Code (ZCTA5) — Maine
- Population Hispanic % by Zip Code (ZCTA5) — Kansas
- Population Hispanic % by Zip Code (ZCTA5) — Colorado