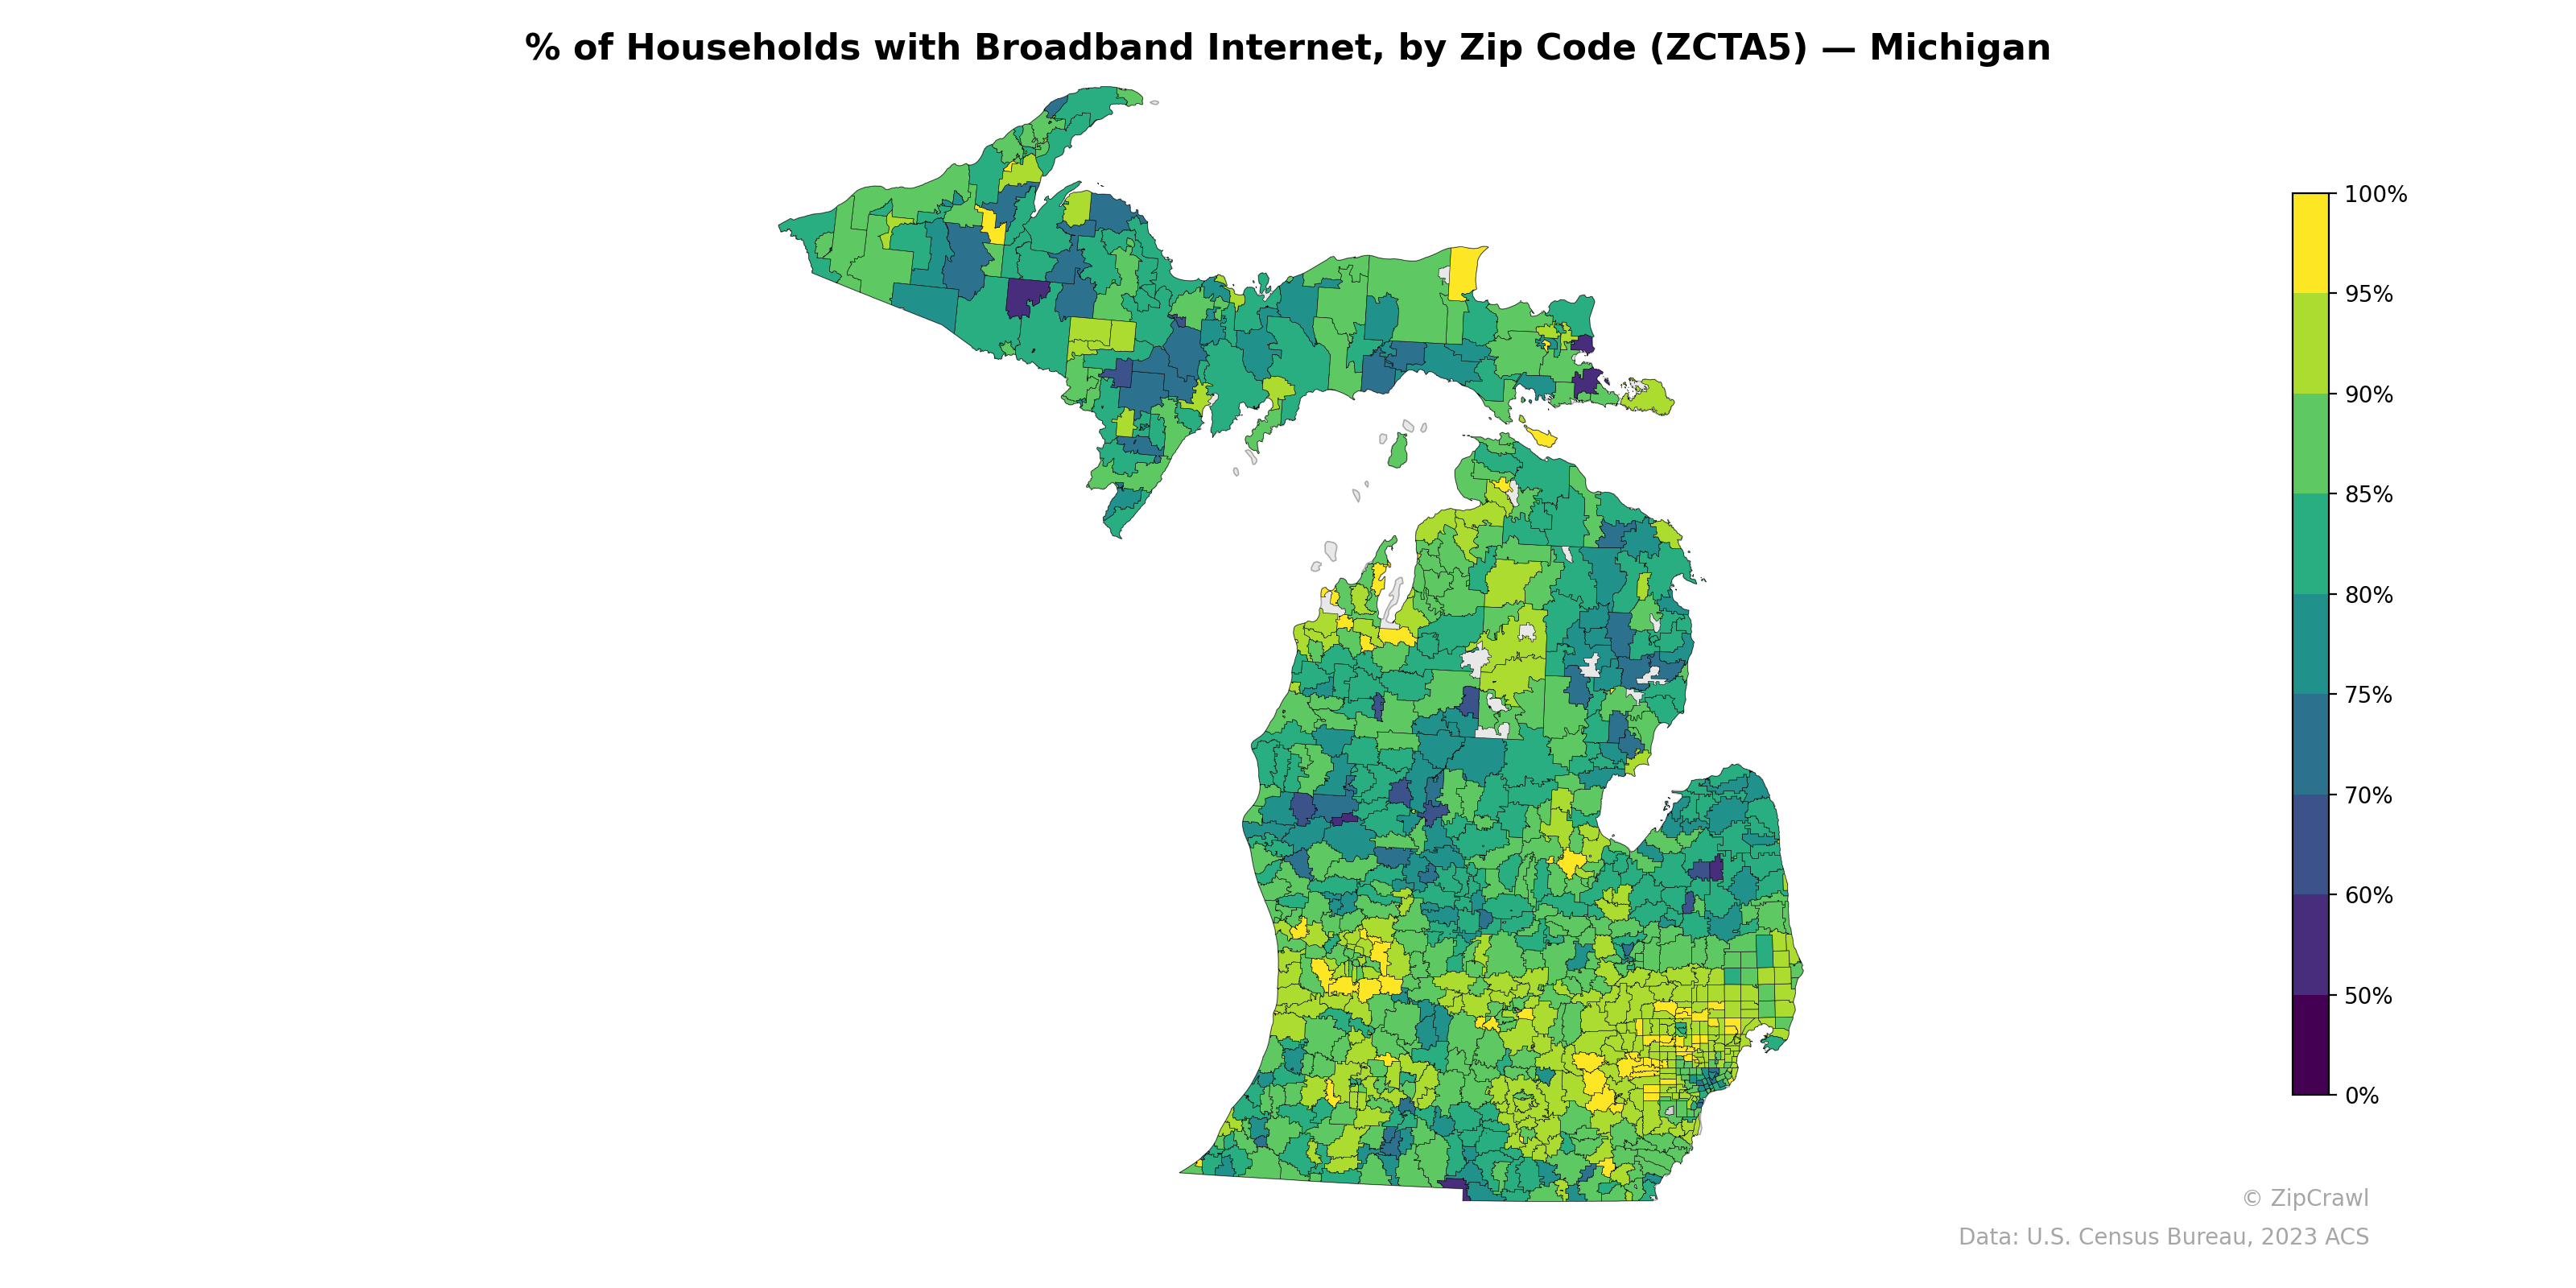
NOTE: Gray indicates insufficient data or a suppressed estimate.
Broadband adoption rates across Michigan exhibit a clear urban-suburban divide, with the Detroit metro area in the southeast displaying the widest range—affluent suburban zip codes reaching above 95% contrast sharply with several inner-city Detroit zip codes falling below 50%, representing the lowest rates statewide. The Upper Peninsula consistently lags behind the Lower Peninsula, with many zip codes in the 60–75% range, likely reflecting limited infrastructure in sparsely populated areas. Mid-Michigan and the Grand Rapids–Lansing corridor generally maintain solid coverage in the 80–90% range, while rural areas in the northern Lower Peninsula show a patchwork pattern with notable pockets of lower connectivity interspersed among higher-performing zones.
Data: U.S. Census Bureau, 2023 ACS
Explore
- Housing Owner-Occupied Median Value ($), by Zip Code (ZCTA5) — New York Metro
- Married Couple (% of all Households) by Zip Code (ZCTA5) — Michigan
- % of Population without Health Insurance, by Zip Code (ZCTA5) — Michigan
- Housing Owner-Occupied Median Value ($), by Zip Code (ZCTA5) — Michigan
- Bachelor's Degree or Higher (% of Over 25) by Zip Code (ZCTA5) — Michigan
- Housing Owner-Occupied % of Units, by Zip Code (ZCTA5) — Michigan
- Housing Vacancy Rate by Zip Code (ZCTA5) — Michigan
- Household Average Size by Zip Code (ZCTA5) — Michigan
- Housing % of Units Built Since 2010, by Zip Code (ZCTA5) — Michigan
- Housing Median Monthly Rent ($), by Zip Code (ZCTA5) — Michigan
- Housing Vacancy Rate by Zip Code (ZCTA5) — Kansas
- Population Non-Hispanic White % by County
- % of Population without Health Insurance, by Zip Code (ZCTA5) — New York Metro
- Married Couple (% of all Households) by Zip Code (ZCTA5) — New York Metro
- Housing % of Units Built Since 2010, by Zip Code (ZCTA5) — New York Metro
- Housing Vacancy Rate by Zip Code (ZCTA5) — New York Metro
- Housing Median Monthly Rent ($), by Zip Code (ZCTA5) — New York Metro
- Household Average Size by Zip Code (ZCTA5) — New York Metro
- Population Non-Hispanic Asian % by Zip Code (ZCTA5) — New York Metro
- Population Non-Hispanic Asian % by Zip Code (ZCTA5) — North Carolina
- Married Couple (% of all Households) by Zip Code (ZCTA5) — North Carolina
- % of Population on Food Stamps or SNAP (Last 12 Months), by Zip Code (ZCTA5) — North Carolina
- % of Population without Health Insurance, by Zip Code (ZCTA5) — North Carolina
- Housing Owner-Occupied Median Value ($), by Zip Code (ZCTA5) — North Carolina
- High School Graduate (% of Over 25) by Zip Code (ZCTA5) — North Carolina
- Housing Owner-Occupied % of Units, by Zip Code (ZCTA5) — North Carolina
- Housing % of Units Built Since 2010, by Zip Code (ZCTA5) — North Carolina
- Household Average Size by Zip Code (ZCTA5) — North Carolina
- Housing Vacancy Rate by Zip Code (ZCTA5) — North Carolina
- Bachelor's Degree or Higher (% of Over 25) by Zip Code (ZCTA5) — North Carolina
- % of Households with Broadband Internet, by Zip Code (ZCTA5) — Maine
- % of Households with Broadband Internet, by Zip Code (ZCTA5) — Iowa
- % of Households with Broadband Internet, by Zip Code (ZCTA5) — Ohio
- % of Households with Broadband Internet, by Zip Code (ZCTA5) — Missouri
- % of Households with Broadband Internet, by Zip Code (ZCTA5) — Maryland
- % of Households with Broadband Internet, by Zip Code (ZCTA5) — Utah
- % of Households with Broadband Internet, by Zip Code (ZCTA5) — Idaho
- % of Households with Broadband Internet, by Zip Code (ZCTA5) — Minnesota
- % of Households with Broadband Internet, by Zip Code (ZCTA5) — Mississippi
- % of Households with Broadband Internet, by Zip Code (ZCTA5) — Montana