NOTE: Gray indicates insufficient data or a suppressed estimate.
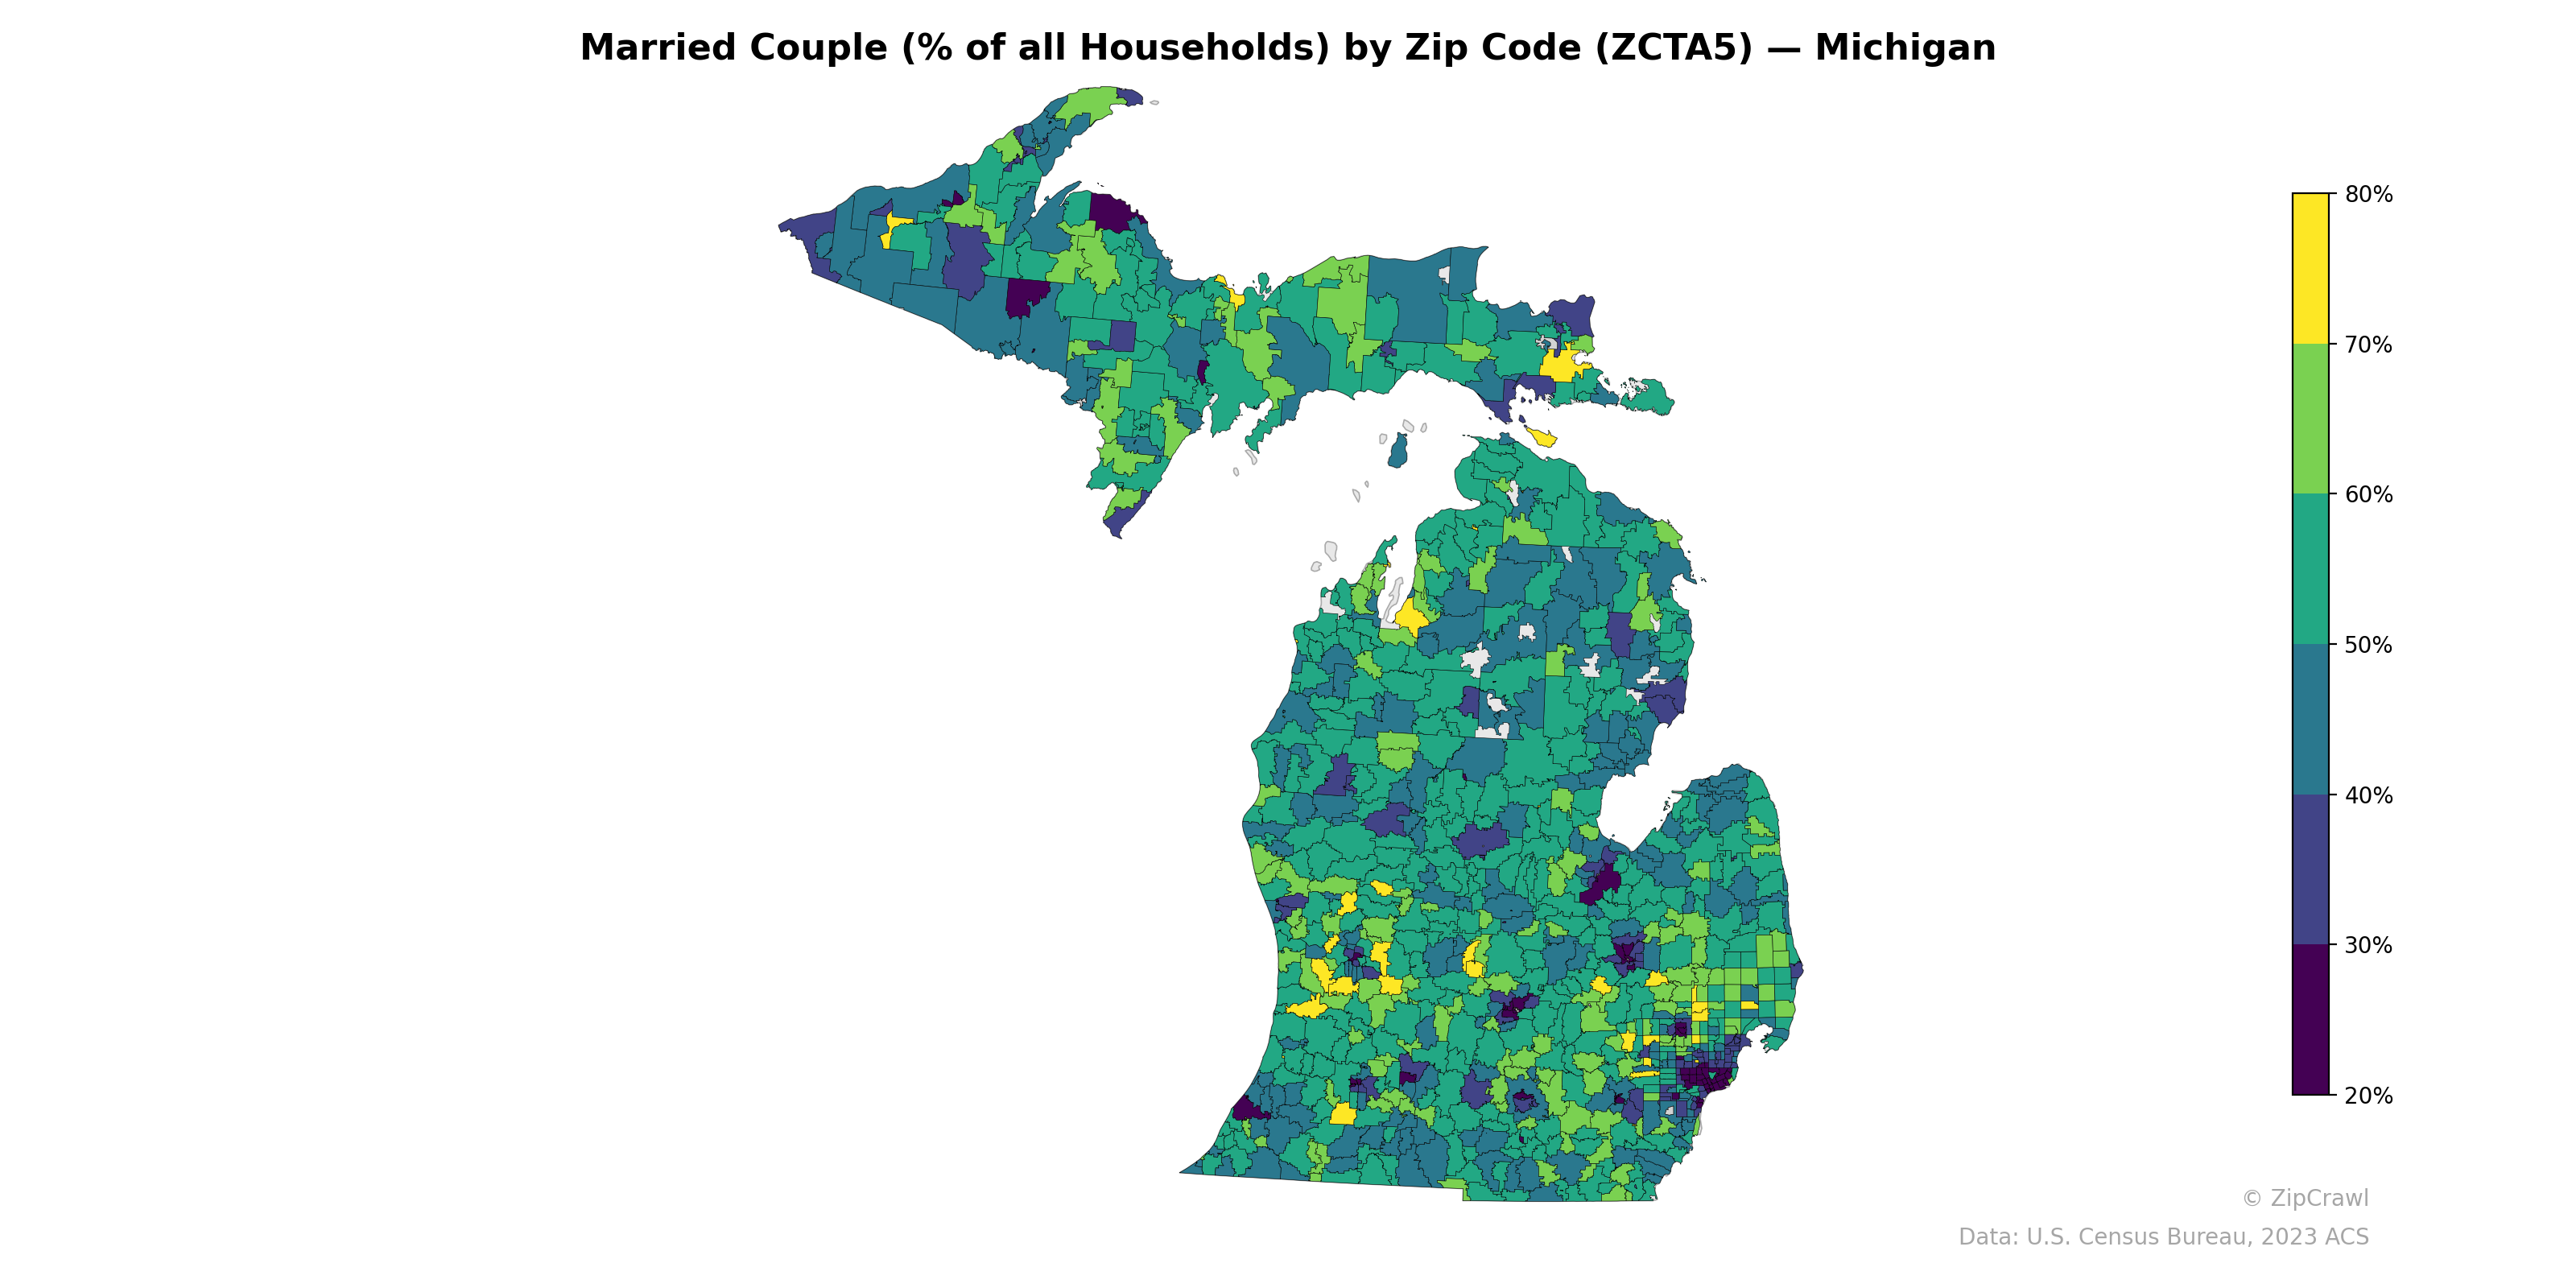
Suburban zip codes ringing the Detroit metro area—particularly in Oakland, Livingston, and western Wayne counties—display the highest married-couple household rates, frequently exceeding 70%, while urban cores in Detroit, Flint, Saginaw, and Lansing register the lowest percentages, often falling below 30%. The Upper Peninsula presents a relatively moderate and uniform distribution mostly in the 50–60% range, with isolated pockets of higher rates in rural western areas and lower rates near Marquette and Sault Ste. Marie. A notable urban-suburban gradient repeats across the state's mid-sized cities, including Grand Rapids, Kalamazoo, and Ann Arbor, where central zip codes contrast sharply with surrounding exurban areas.
Data: U.S. Census Bureau, 2023 ACS
Explore
- Housing Owner-Occupied Median Value ($), by Zip Code (ZCTA5) — New York Metro
- Housing Vacancy Rate by Zip Code (ZCTA5) — New York Metro
- Bachelor's Degree or Higher (% of Over 25) by Zip Code (ZCTA5) — Michigan
- Housing Median Monthly Rent ($), by Zip Code (ZCTA5) — Michigan
- Housing Vacancy Rate by Zip Code (ZCTA5) — Michigan
- % of Population without Health Insurance, by Zip Code (ZCTA5) — Michigan
- Housing % of Units Built Since 2010, by Zip Code (ZCTA5) — Michigan
- % of Households with Broadband Internet, by Zip Code (ZCTA5) — Michigan
- Housing Owner-Occupied % of Units, by Zip Code (ZCTA5) — Michigan
- Housing Owner-Occupied Median Value ($), by Zip Code (ZCTA5) — Michigan
- Household Average Size by Zip Code (ZCTA5) — Michigan
- Population Hispanic % by Zip Code (ZCTA5) — New Mexico
- Population Non-Hispanic White % by County
- % of Population without Health Insurance, by Zip Code (ZCTA5) — New York Metro
- Household Average Size by Zip Code (ZCTA5) — New York Metro
- % of Households with Broadband Internet, by Zip Code (ZCTA5) — New York Metro
- Housing % of Units Built Since 2010, by Zip Code (ZCTA5) — New York Metro
- Housing Median Monthly Rent ($), by Zip Code (ZCTA5) — New York Metro
- Population Non-Hispanic Asian % by Zip Code (ZCTA5) — New York Metro
- Housing Vacancy Rate by Zip Code (ZCTA5) — North Carolina
- Housing % of Units Built Since 2010, by Zip Code (ZCTA5) — North Carolina
- Population Non-Hispanic Asian % by Zip Code (ZCTA5) — North Carolina
- Bachelor's Degree or Higher (% of Over 25) by Zip Code (ZCTA5) — North Carolina
- % of Population without Health Insurance, by Zip Code (ZCTA5) — North Carolina
- Population Non-Hispanic American Indian % by Zip Code (ZCTA5) — North Carolina
- % of Households with Broadband Internet, by Zip Code (ZCTA5) — North Carolina
- Housing Owner-Occupied Median Value ($), by Zip Code (ZCTA5) — North Carolina
- Housing Median Monthly Rent ($), by Zip Code (ZCTA5) — North Carolina
- Household Average Size by Zip Code (ZCTA5) — North Carolina
- High School Graduate (% of Over 25) by Zip Code (ZCTA5) — North Carolina
- Married Couple (% of all Households) by Zip Code (ZCTA5) — Ohio
- Married Couple (% of all Households) by Zip Code (ZCTA5) — Maine
- Married Couple (% of all Households) by Zip Code (ZCTA5) — Utah
- Married Couple (% of all Households) by Zip Code (ZCTA5) — Iowa
- Married Couple (% of all Households) by Zip Code (ZCTA5) — Alaska
- Married Couple (% of all Households) by Zip Code (ZCTA5) — Missouri
- Married Couple (% of all Households) by Zip Code (ZCTA5) — Alabama
- Married Couple (% of all Households) by Zip Code (ZCTA5) — Texas
- Married Couple (% of all Households) by Zip Code (ZCTA5) — Oregon
- Married Couple (% of all Households) by Zip Code (ZCTA5) — Maryland