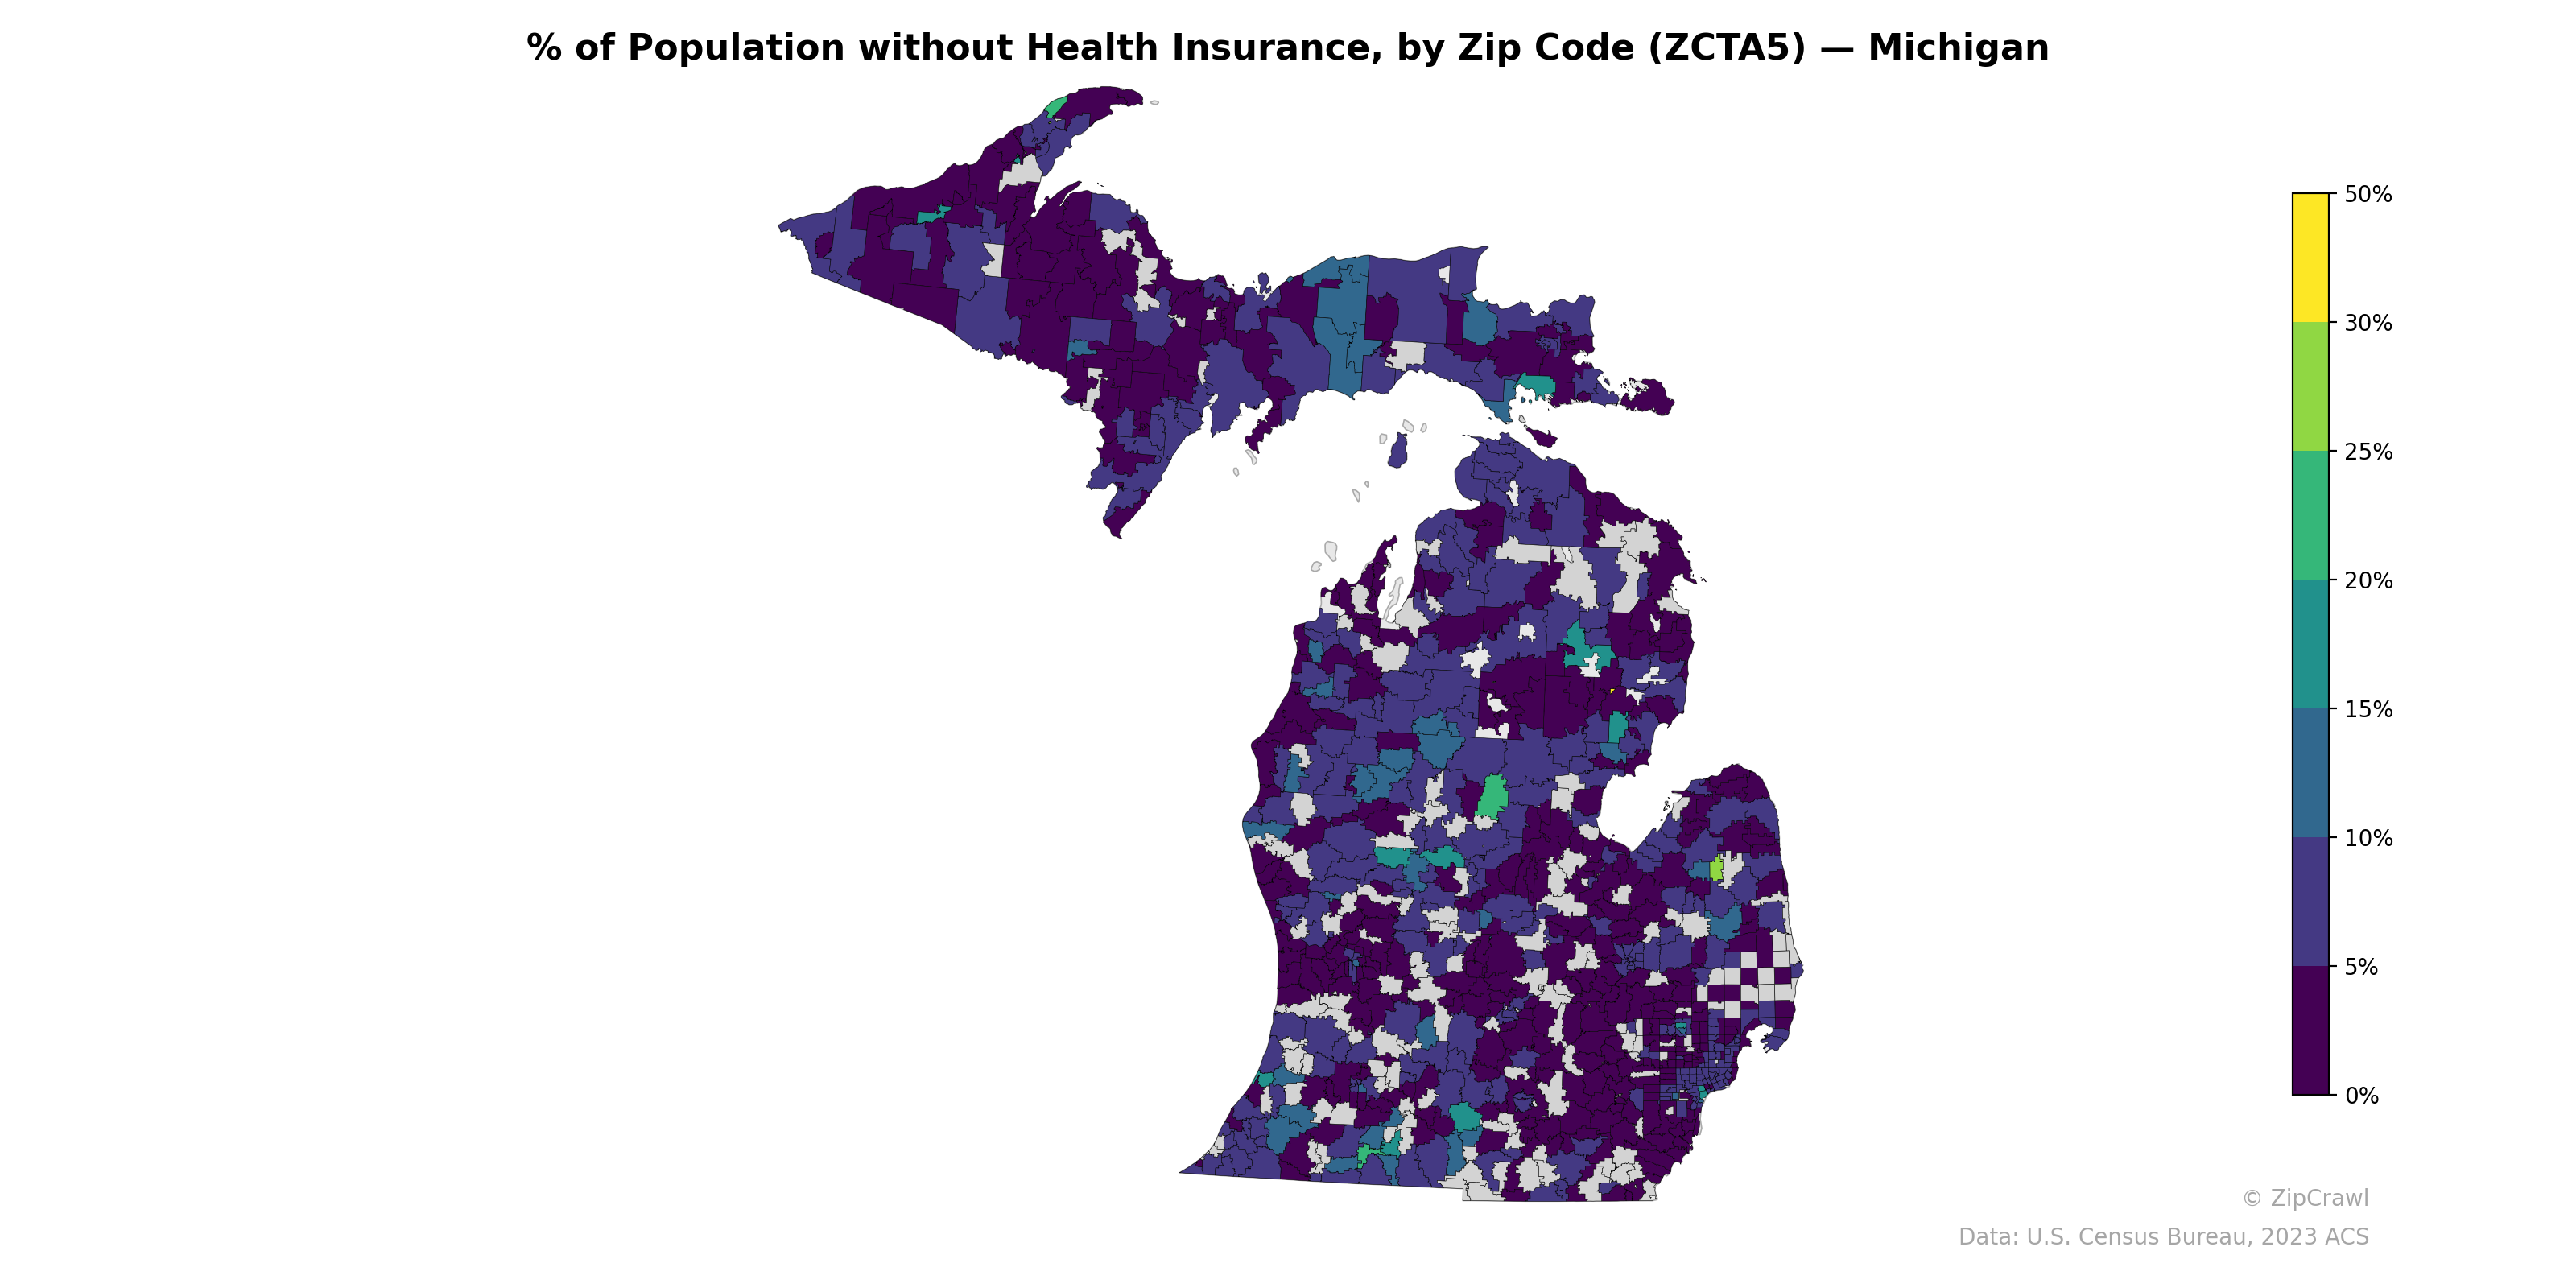
NOTE: Gray indicates insufficient data or a suppressed estimate.
Michigan's uninsured rates are generally low across much of the state, with the majority of zip codes falling below 10%, though notable pockets of higher uninsured populations (15–25%+) appear in parts of the central Lower Peninsula and scattered areas of the Upper Peninsula. The southeast Michigan metro Detroit region displays a distinctive checkerboard pattern, with adjacent zip codes showing sharp contrasts between very low and moderately high uninsured rates, likely reflecting stark socioeconomic disparities across municipal boundaries. Several isolated zip codes in the agricultural western and central parts of the Lower Peninsula show elevated uninsured rates reaching into the green range (10–15%+), potentially correlating with rural communities or areas with higher immigrant farmworker populations.
Data: U.S. Census Bureau, 2023 ACS
Explore
- Housing Owner-Occupied Median Value ($), by Zip Code (ZCTA5) — New York Metro
- Married Couple (% of all Households) by Zip Code (ZCTA5) — Michigan
- % of Households with Broadband Internet, by Zip Code (ZCTA5) — Michigan
- Housing Owner-Occupied Median Value ($), by Zip Code (ZCTA5) — Michigan
- Bachelor's Degree or Higher (% of Over 25) by Zip Code (ZCTA5) — Michigan
- Housing Owner-Occupied % of Units, by Zip Code (ZCTA5) — Michigan
- Household Average Size by Zip Code (ZCTA5) — Michigan
- Housing Vacancy Rate by Zip Code (ZCTA5) — Michigan
- Housing % of Units Built Since 2010, by Zip Code (ZCTA5) — Michigan
- Housing Median Monthly Rent ($), by Zip Code (ZCTA5) — Michigan
- Population Non-Hispanic Asian % by Zip Code (ZCTA5) — Kansas
- Population Non-Hispanic White % by County
- Population Non-Hispanic Asian % by Zip Code (ZCTA5) — New York Metro
- Household Average Size by Zip Code (ZCTA5) — New York Metro
- % of Households with Broadband Internet, by Zip Code (ZCTA5) — New York Metro
- Housing % of Units Built Since 2010, by Zip Code (ZCTA5) — New York Metro
- Housing Vacancy Rate by Zip Code (ZCTA5) — New York Metro
- Housing Median Monthly Rent ($), by Zip Code (ZCTA5) — New York Metro
- Married Couple (% of all Households) by Zip Code (ZCTA5) — New York Metro
- Population Non-Hispanic Asian % by Zip Code (ZCTA5) — North Carolina
- Married Couple (% of all Households) by Zip Code (ZCTA5) — North Carolina
- % of Population on Food Stamps or SNAP (Last 12 Months), by Zip Code (ZCTA5) — North Carolina
- % of Households with Broadband Internet, by Zip Code (ZCTA5) — North Carolina
- Housing Owner-Occupied Median Value ($), by Zip Code (ZCTA5) — North Carolina
- High School Graduate (% of Over 25) by Zip Code (ZCTA5) — North Carolina
- Housing Owner-Occupied % of Units, by Zip Code (ZCTA5) — North Carolina
- Housing % of Units Built Since 2010, by Zip Code (ZCTA5) — North Carolina
- Household Average Size by Zip Code (ZCTA5) — North Carolina
- Housing Vacancy Rate by Zip Code (ZCTA5) — North Carolina
- Bachelor's Degree or Higher (% of Over 25) by Zip Code (ZCTA5) — North Carolina
- % of Population without Health Insurance, by Zip Code (ZCTA5) — Maine
- % of Population without Health Insurance, by Zip Code (ZCTA5) — Ohio
- % of Population without Health Insurance, by Zip Code (ZCTA5) — Iowa
- % of Population without Health Insurance, by Zip Code (ZCTA5) — Missouri
- % of Population without Health Insurance, by Zip Code (ZCTA5) — Utah
- % of Population without Health Insurance, by Zip Code (ZCTA5) — Oregon
- % of Population without Health Insurance, by Zip Code (ZCTA5) — Idaho
- % of Population without Health Insurance, by Zip Code (ZCTA5) — Minnesota
- % of Population without Health Insurance, by Zip Code (ZCTA5) — Mississippi
- % of Population without Health Insurance, by Zip Code (ZCTA5) — Montana