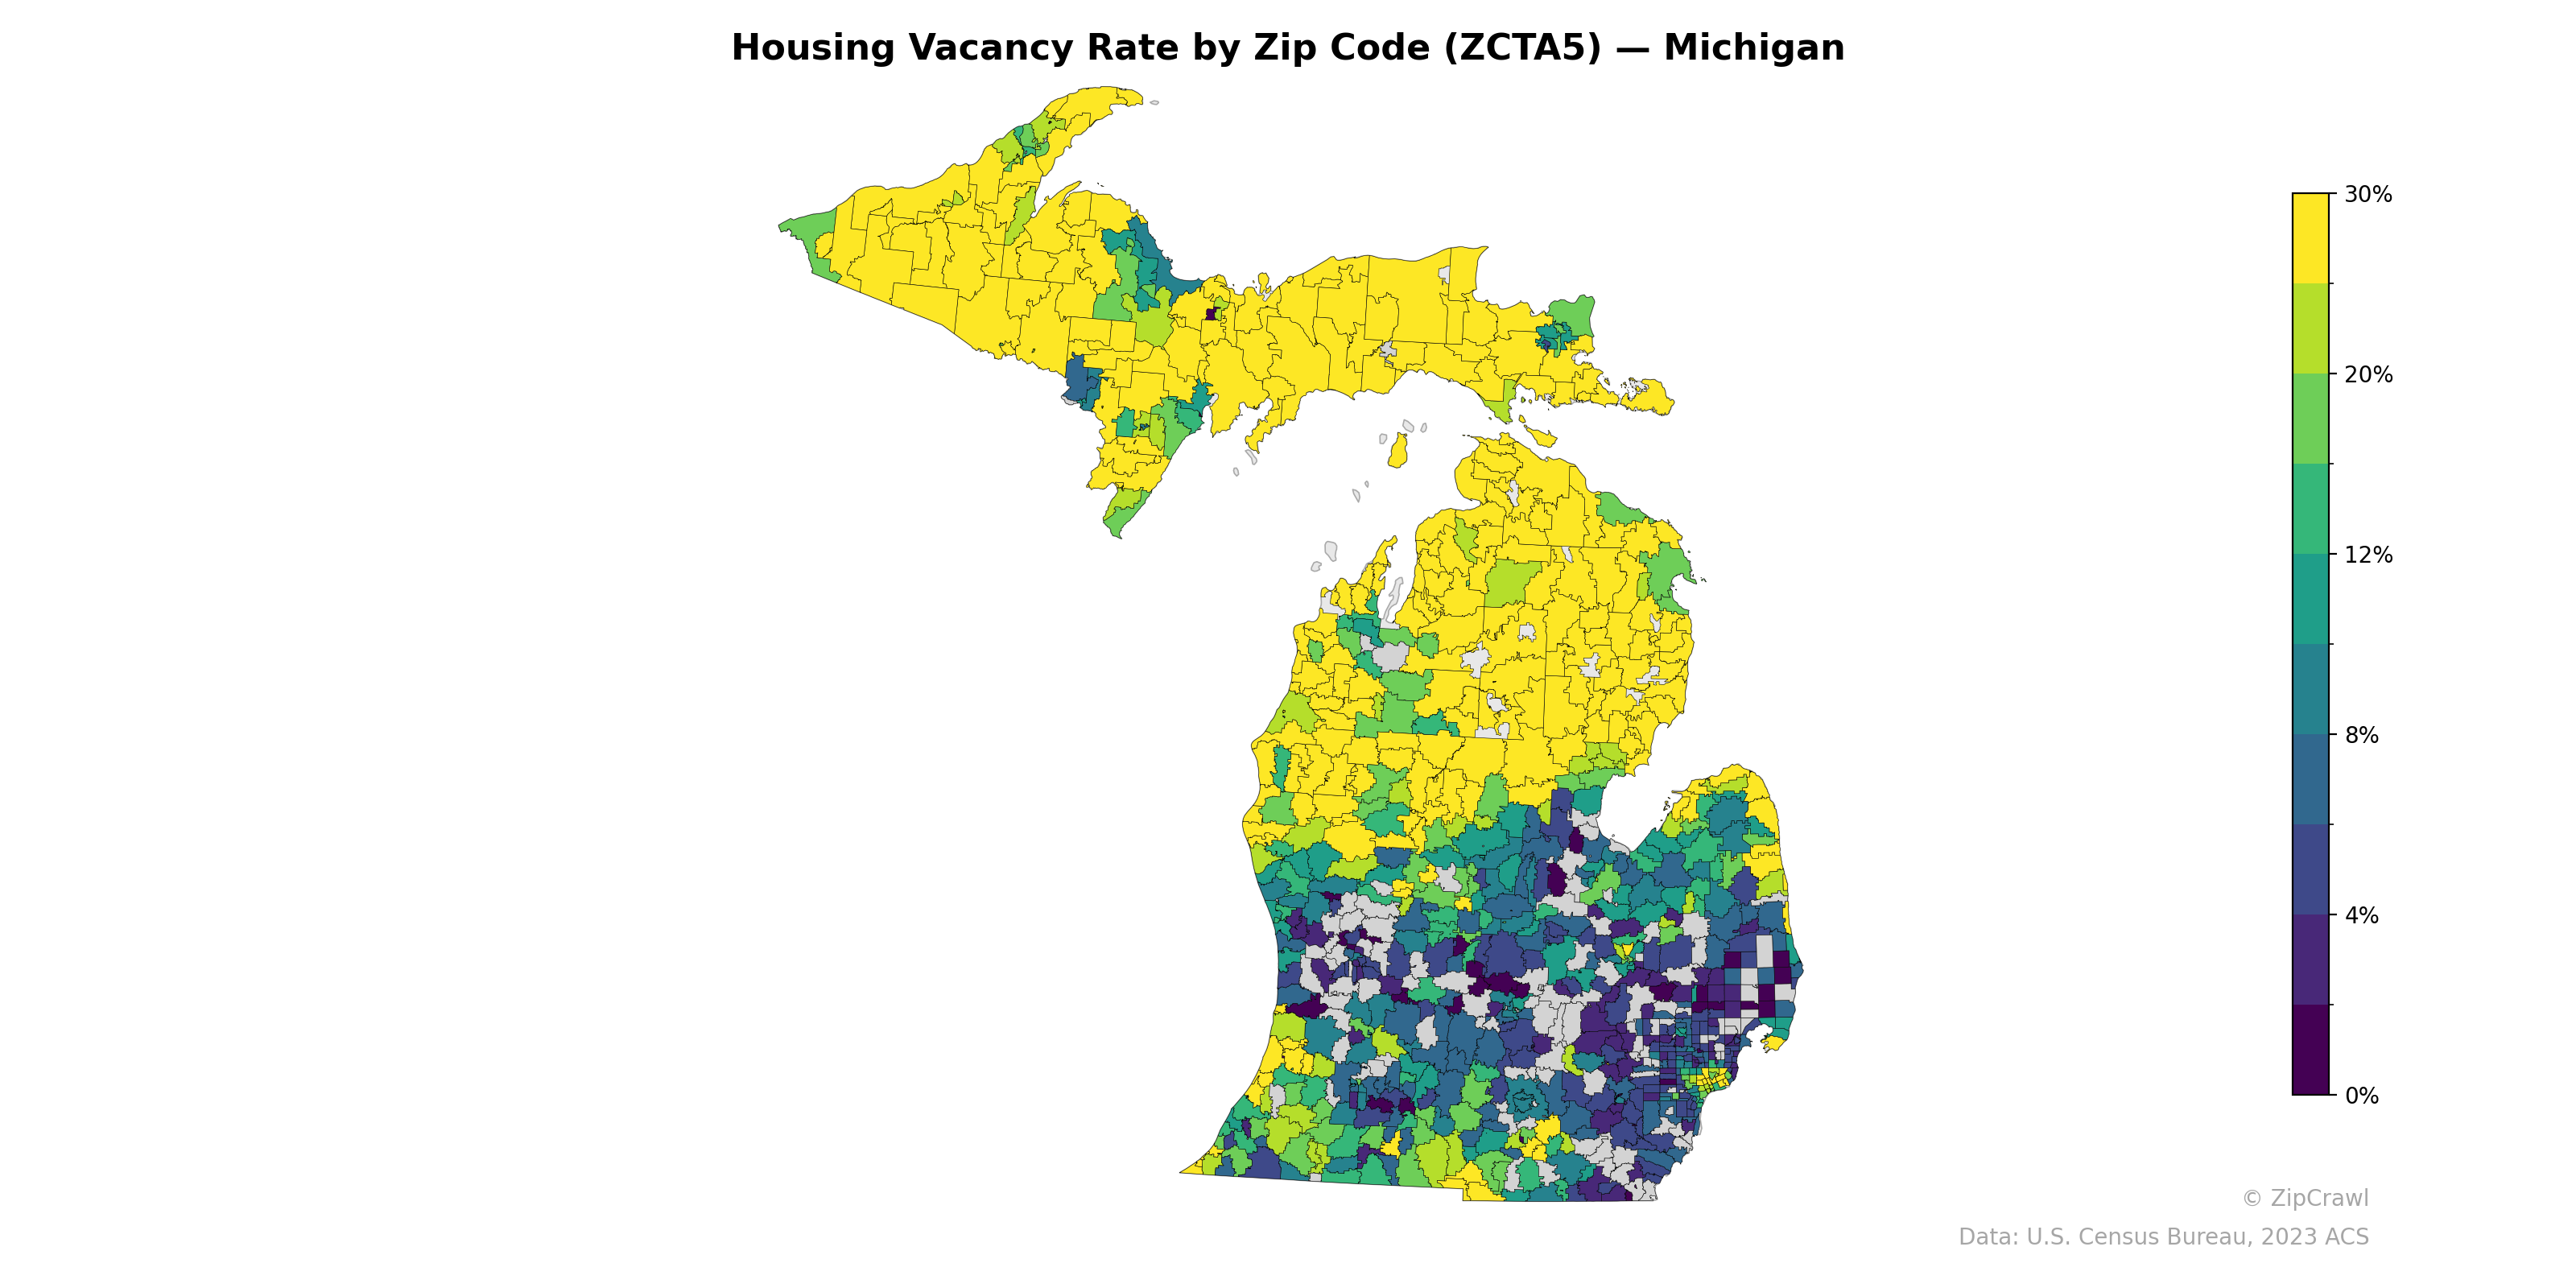
NOTE: Gray indicates insufficient data or a suppressed estimate.
The Upper Peninsula and northern Lower Peninsula exhibit predominantly high vacancy rates exceeding 20-30%, consistent with seasonal and vacation housing stock in rural and resort communities along the Lake Michigan and Lake Huron shorelines. A sharp contrast emerges in the southeastern Lower Peninsula, where the Detroit metropolitan area and surrounding suburban zip codes display vacancy rates generally below 4-8%, reflecting denser, year-round occupied housing markets. Mid-state transitional zones, particularly around the Grand Rapids, Lansing, and Traverse City corridors, show moderate vacancy rates in the 8-12% range with pockets of lower vacancy near urban cores.
Data: U.S. Census Bureau, 2023 ACS
Explore
- Housing Owner-Occupied Median Value ($), by Zip Code (ZCTA5) — New York Metro
- Population Non-Hispanic Asian % by Zip Code (ZCTA5) — New York Metro
- Bachelor's Degree or Higher (% of Over 25) by Zip Code (ZCTA5) — Michigan
- Housing Median Monthly Rent ($), by Zip Code (ZCTA5) — Michigan
- Married Couple (% of all Households) by Zip Code (ZCTA5) — Michigan
- % of Population without Health Insurance, by Zip Code (ZCTA5) — Michigan
- % of Households with Broadband Internet, by Zip Code (ZCTA5) — Michigan
- Housing % of Units Built Since 2010, by Zip Code (ZCTA5) — Michigan
- Housing Owner-Occupied % of Units, by Zip Code (ZCTA5) — Michigan
- Housing Owner-Occupied Median Value ($), by Zip Code (ZCTA5) — Michigan
- Household Average Size by Zip Code (ZCTA5) — Michigan
- Population Non-Hispanic Black % by Zip Code (ZCTA5) — New Mexico
- Population Non-Hispanic White % by County
- % of Population without Health Insurance, by Zip Code (ZCTA5) — New York Metro
- Housing Median Monthly Rent ($), by Zip Code (ZCTA5) — New York Metro
- Married Couple (% of all Households) by Zip Code (ZCTA5) — New York Metro
- % of Households with Broadband Internet, by Zip Code (ZCTA5) — New York Metro
- Household Average Size by Zip Code (ZCTA5) — New York Metro
- Housing % of Units Built Since 2010, by Zip Code (ZCTA5) — New York Metro
- Population Non-Hispanic Asian % by Zip Code (ZCTA5) — North Carolina
- Household Average Size by Zip Code (ZCTA5) — North Carolina
- % of Population on Food Stamps or SNAP (Last 12 Months), by Zip Code (ZCTA5) — North Carolina
- % of Households with Broadband Internet, by Zip Code (ZCTA5) — North Carolina
- Housing Owner-Occupied % of Units, by Zip Code (ZCTA5) — North Carolina
- High School Graduate (% of Over 25) by Zip Code (ZCTA5) — North Carolina
- % of Population without Health Insurance, by Zip Code (ZCTA5) — North Carolina
- Housing Median Monthly Rent ($), by Zip Code (ZCTA5) — North Carolina
- Housing % of Units Built Since 2010, by Zip Code (ZCTA5) — North Carolina
- Married Couple (% of all Households) by Zip Code (ZCTA5) — North Carolina
- Bachelor's Degree or Higher (% of Over 25) by Zip Code (ZCTA5) — North Carolina
- Housing Vacancy Rate by Zip Code (ZCTA5) — Maine
- Housing Vacancy Rate by Zip Code (ZCTA5) — Missouri
- Housing Vacancy Rate by Zip Code (ZCTA5) — Iowa
- Housing Vacancy Rate by Zip Code (ZCTA5) — Utah
- Housing Vacancy Rate by Zip Code (ZCTA5) — Ohio
- Housing Vacancy Rate by Zip Code (ZCTA5) — Minnesota
- Housing Vacancy Rate by Zip Code (ZCTA5) — Mississippi
- Housing Vacancy Rate by Zip Code (ZCTA5) — Montana
- Housing Vacancy Rate by Zip Code (ZCTA5) — Texas
- Housing Vacancy Rate by Zip Code (ZCTA5) — Idaho