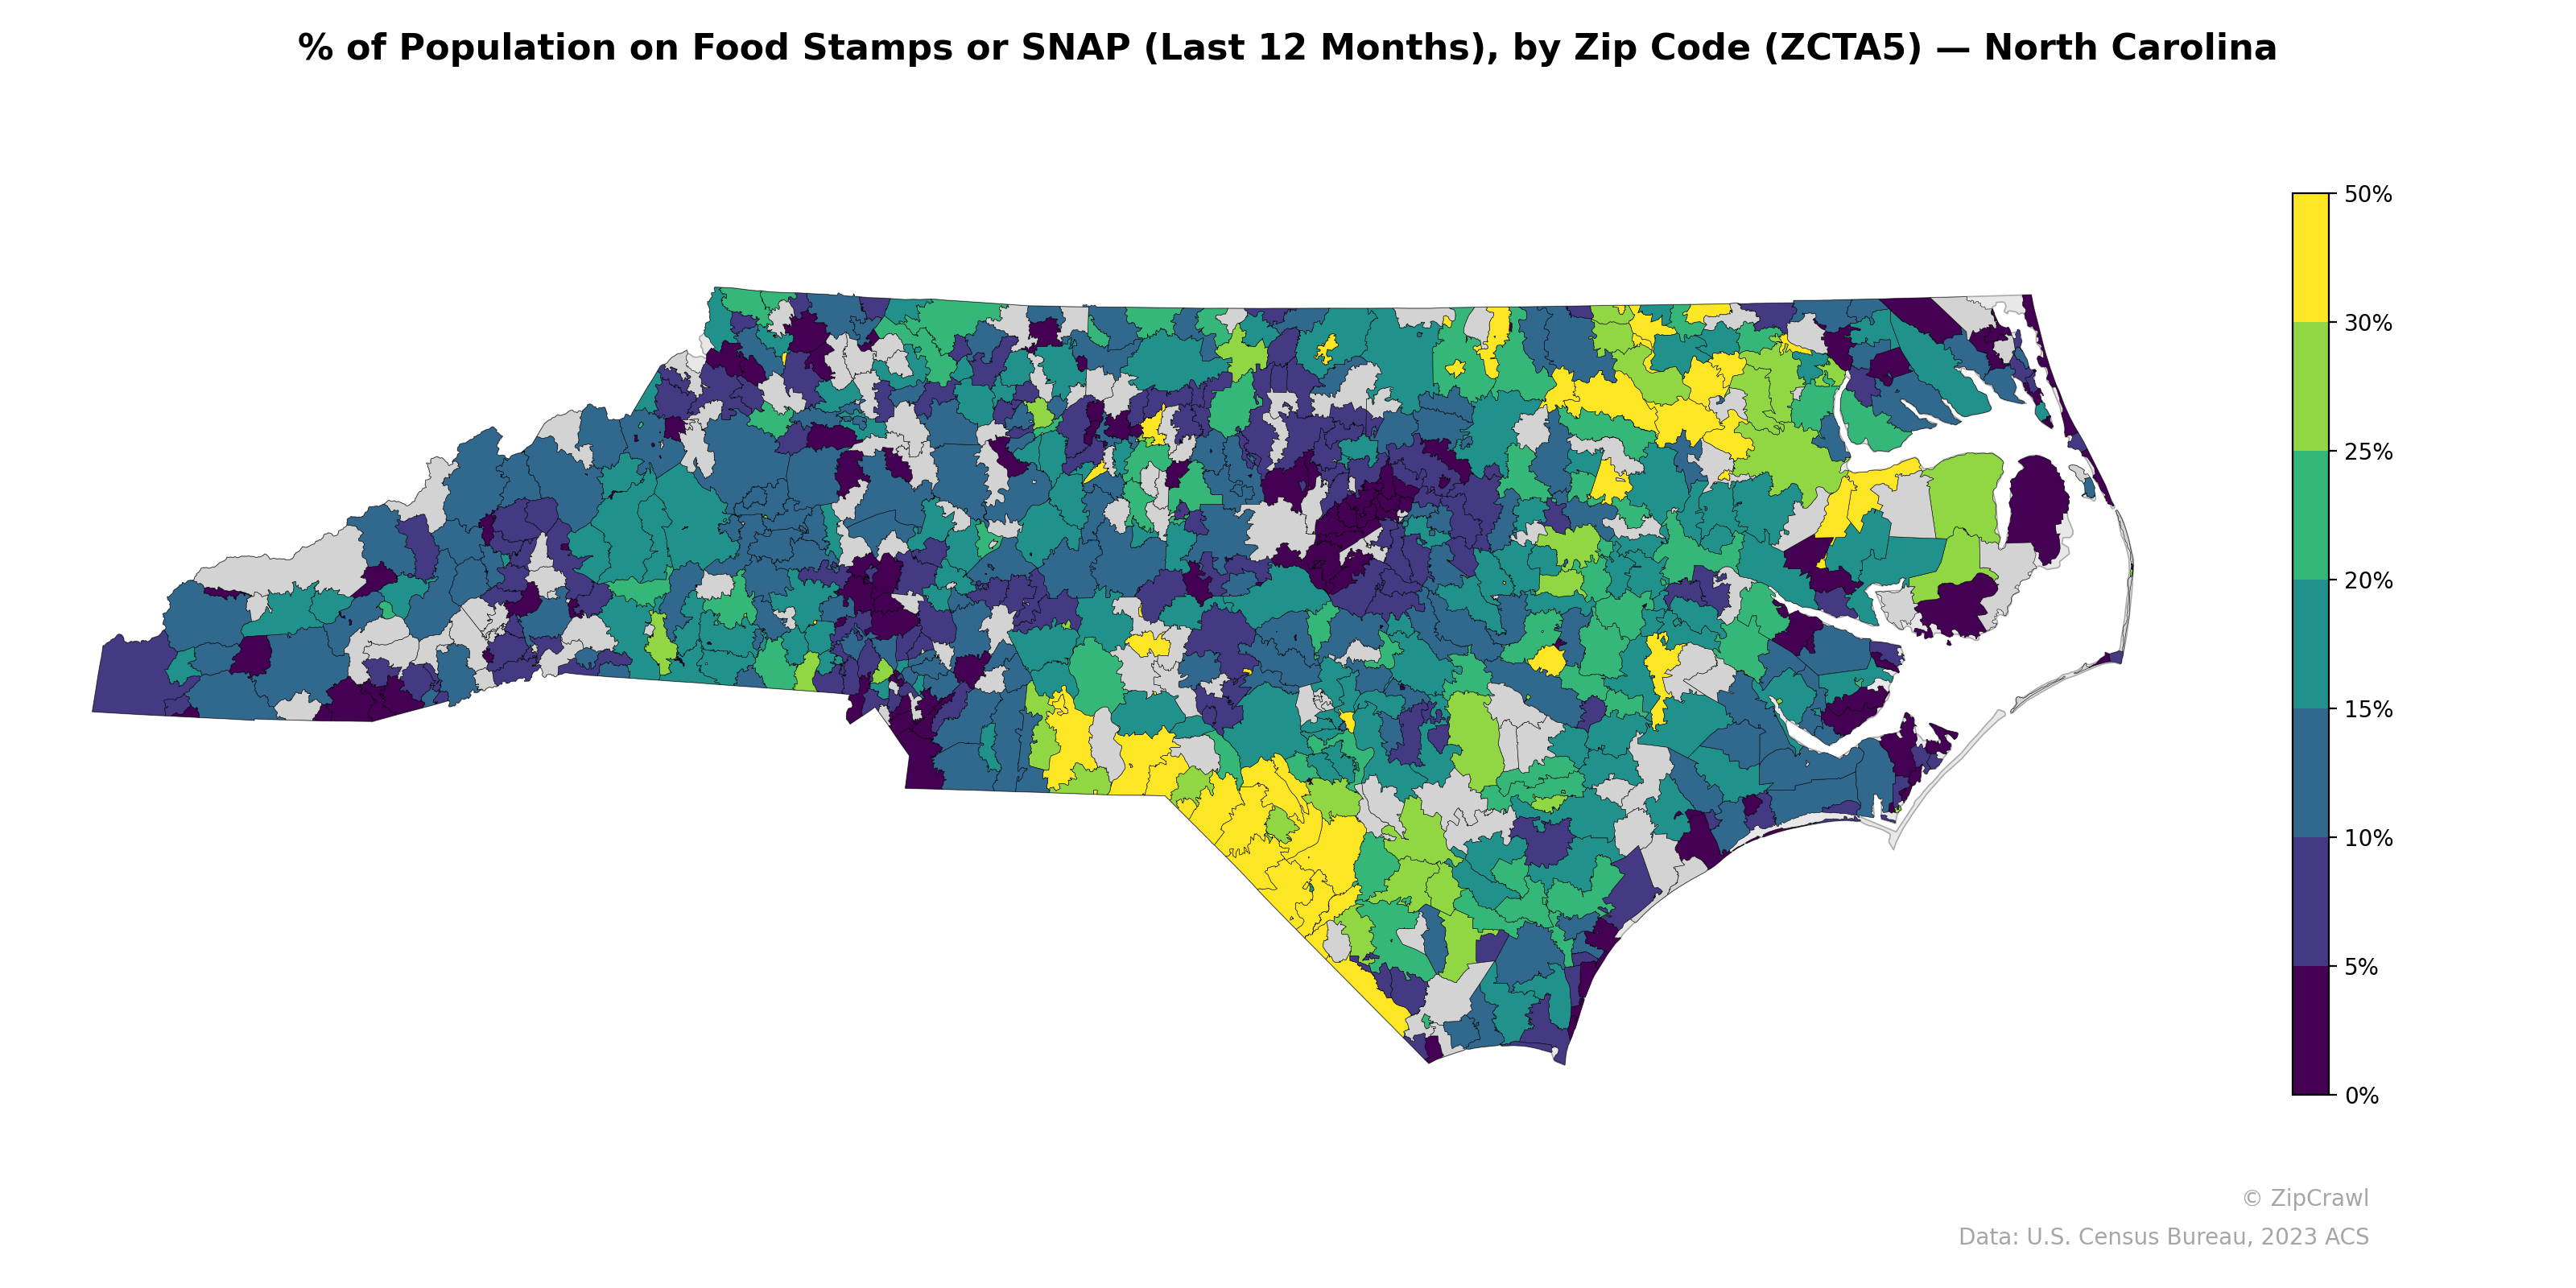
NOTE: Gray indicates insufficient data or a suppressed estimate.
Elevated SNAP participation rates exceeding 30% cluster prominently in the southeastern Coastal Plain and Sandhills region, particularly in zip codes spanning Robeson, Columbus, and Bladen counties, as well as pockets in the northeastern Inner Banks area around Halifax and Bertie counties. The western mountain region and piedmont urban-suburban corridors—especially zip codes surrounding Charlotte, Raleigh-Durham, and Asheville—generally exhibit lower participation rates below 10-15%, reflecting stronger labor markets and higher median incomes. A notable contrast exists between rural eastern North Carolina, where SNAP usage is persistently high across broad contiguous areas, and the fragmented pockets of high usage in western counties that tend to be more isolated and interspersed with lower-rate neighbors.
Data: U.S. Census Bureau, 2023 ACS
Explore
- % of Population without Health Insurance, by Zip Code (ZCTA5) — New York Metro
- Household Median Income by Zip Code (ZCTA5) — Michigan
- Population Hispanic % by Zip Code (ZCTA5) — Michigan
- Population Non-Hispanic White % by Zip Code (ZCTA5) — Michigan
- Population Non-Hispanic American Indian % by Zip Code (ZCTA5) — Michigan
- High School Graduate (% of Over 25) by Zip Code (ZCTA5) — Michigan
- U.S. Citizens (% of Population Over 18) by Zip Code (ZCTA5) — Michigan
- Population Non-Hispanic Asian % by Zip Code (ZCTA5) — North Carolina
- Population Non-Hispanic Black % by Zip Code (ZCTA5) — Michigan
- Median Age by Zip Code (ZCTA5) — Michigan
- High School Graduate (% of Over 25) by Zip Code (ZCTA5) — Kansas
- Population Non-Hispanic White % by County
- U.S. Citizens (% of Population Over 18) by Zip Code (ZCTA5) — New York Metro
- Population Non-Hispanic Asian % by Zip Code (ZCTA5) — New York Metro
- Housing Vacancy Rate by Zip Code (ZCTA5) — New York Metro
- Household Average Size by Zip Code (ZCTA5) — New York Metro
- Housing Owner-Occupied Median Value ($), by Zip Code (ZCTA5) — New York Metro
- Housing Median Monthly Rent ($), by Zip Code (ZCTA5) — New York Metro
- % of Households with Broadband Internet, by Zip Code (ZCTA5) — New York Metro
- Housing % of Units Built Since 2010, by Zip Code (ZCTA5) — New York Metro
- Married Couple (% of all Households) by Zip Code (ZCTA5) — New York Metro
- Household Average Size by Zip Code (ZCTA5) — North Carolina
- Housing Median Monthly Rent ($), by Zip Code (ZCTA5) — North Carolina
- Married Couple (% of all Households) by Zip Code (ZCTA5) — North Carolina
- Bachelor's Degree or Higher (% of Over 25) by Zip Code (ZCTA5) — North Carolina
- High School Graduate (% of Over 25) by Zip Code (ZCTA5) — North Carolina
- Housing Owner-Occupied % of Units, by Zip Code (ZCTA5) — North Carolina
- Housing Owner-Occupied Median Value ($), by Zip Code (ZCTA5) — North Carolina
- Housing % of Units Built Since 2010, by Zip Code (ZCTA5) — North Carolina
- % of Households with Broadband Internet, by Zip Code (ZCTA5) — North Carolina
- % of Population on Food Stamps or SNAP (Last 12 Months), by Zip Code (ZCTA5) — South Carolina
- % of Population on Food Stamps or SNAP (Last 12 Months), by Zip Code (ZCTA5) — North Dakota
- % of Population on Food Stamps or SNAP (Last 12 Months), by Zip Code (ZCTA5) — Montana
- % of Population on Food Stamps or SNAP (Last 12 Months), by Zip Code (ZCTA5) — Ohio
- % of Population on Food Stamps or SNAP (Last 12 Months), by Zip Code (ZCTA5) — Oregon
- % of Population on Food Stamps or SNAP (Last 12 Months), by Zip Code (ZCTA5) — Nevada
- % of Population on Food Stamps or SNAP (Last 12 Months), by Zip Code (ZCTA5) — Iowa
- % of Population on Food Stamps or SNAP (Last 12 Months), by Zip Code (ZCTA5) — Maine
- % of Population on Food Stamps or SNAP (Last 12 Months), by Zip Code (ZCTA5) — Utah
- % of Population on Food Stamps or SNAP (Last 12 Months), by Zip Code (ZCTA5) — Arizona