NOTE: Gray indicates insufficient data or a suppressed estimate.
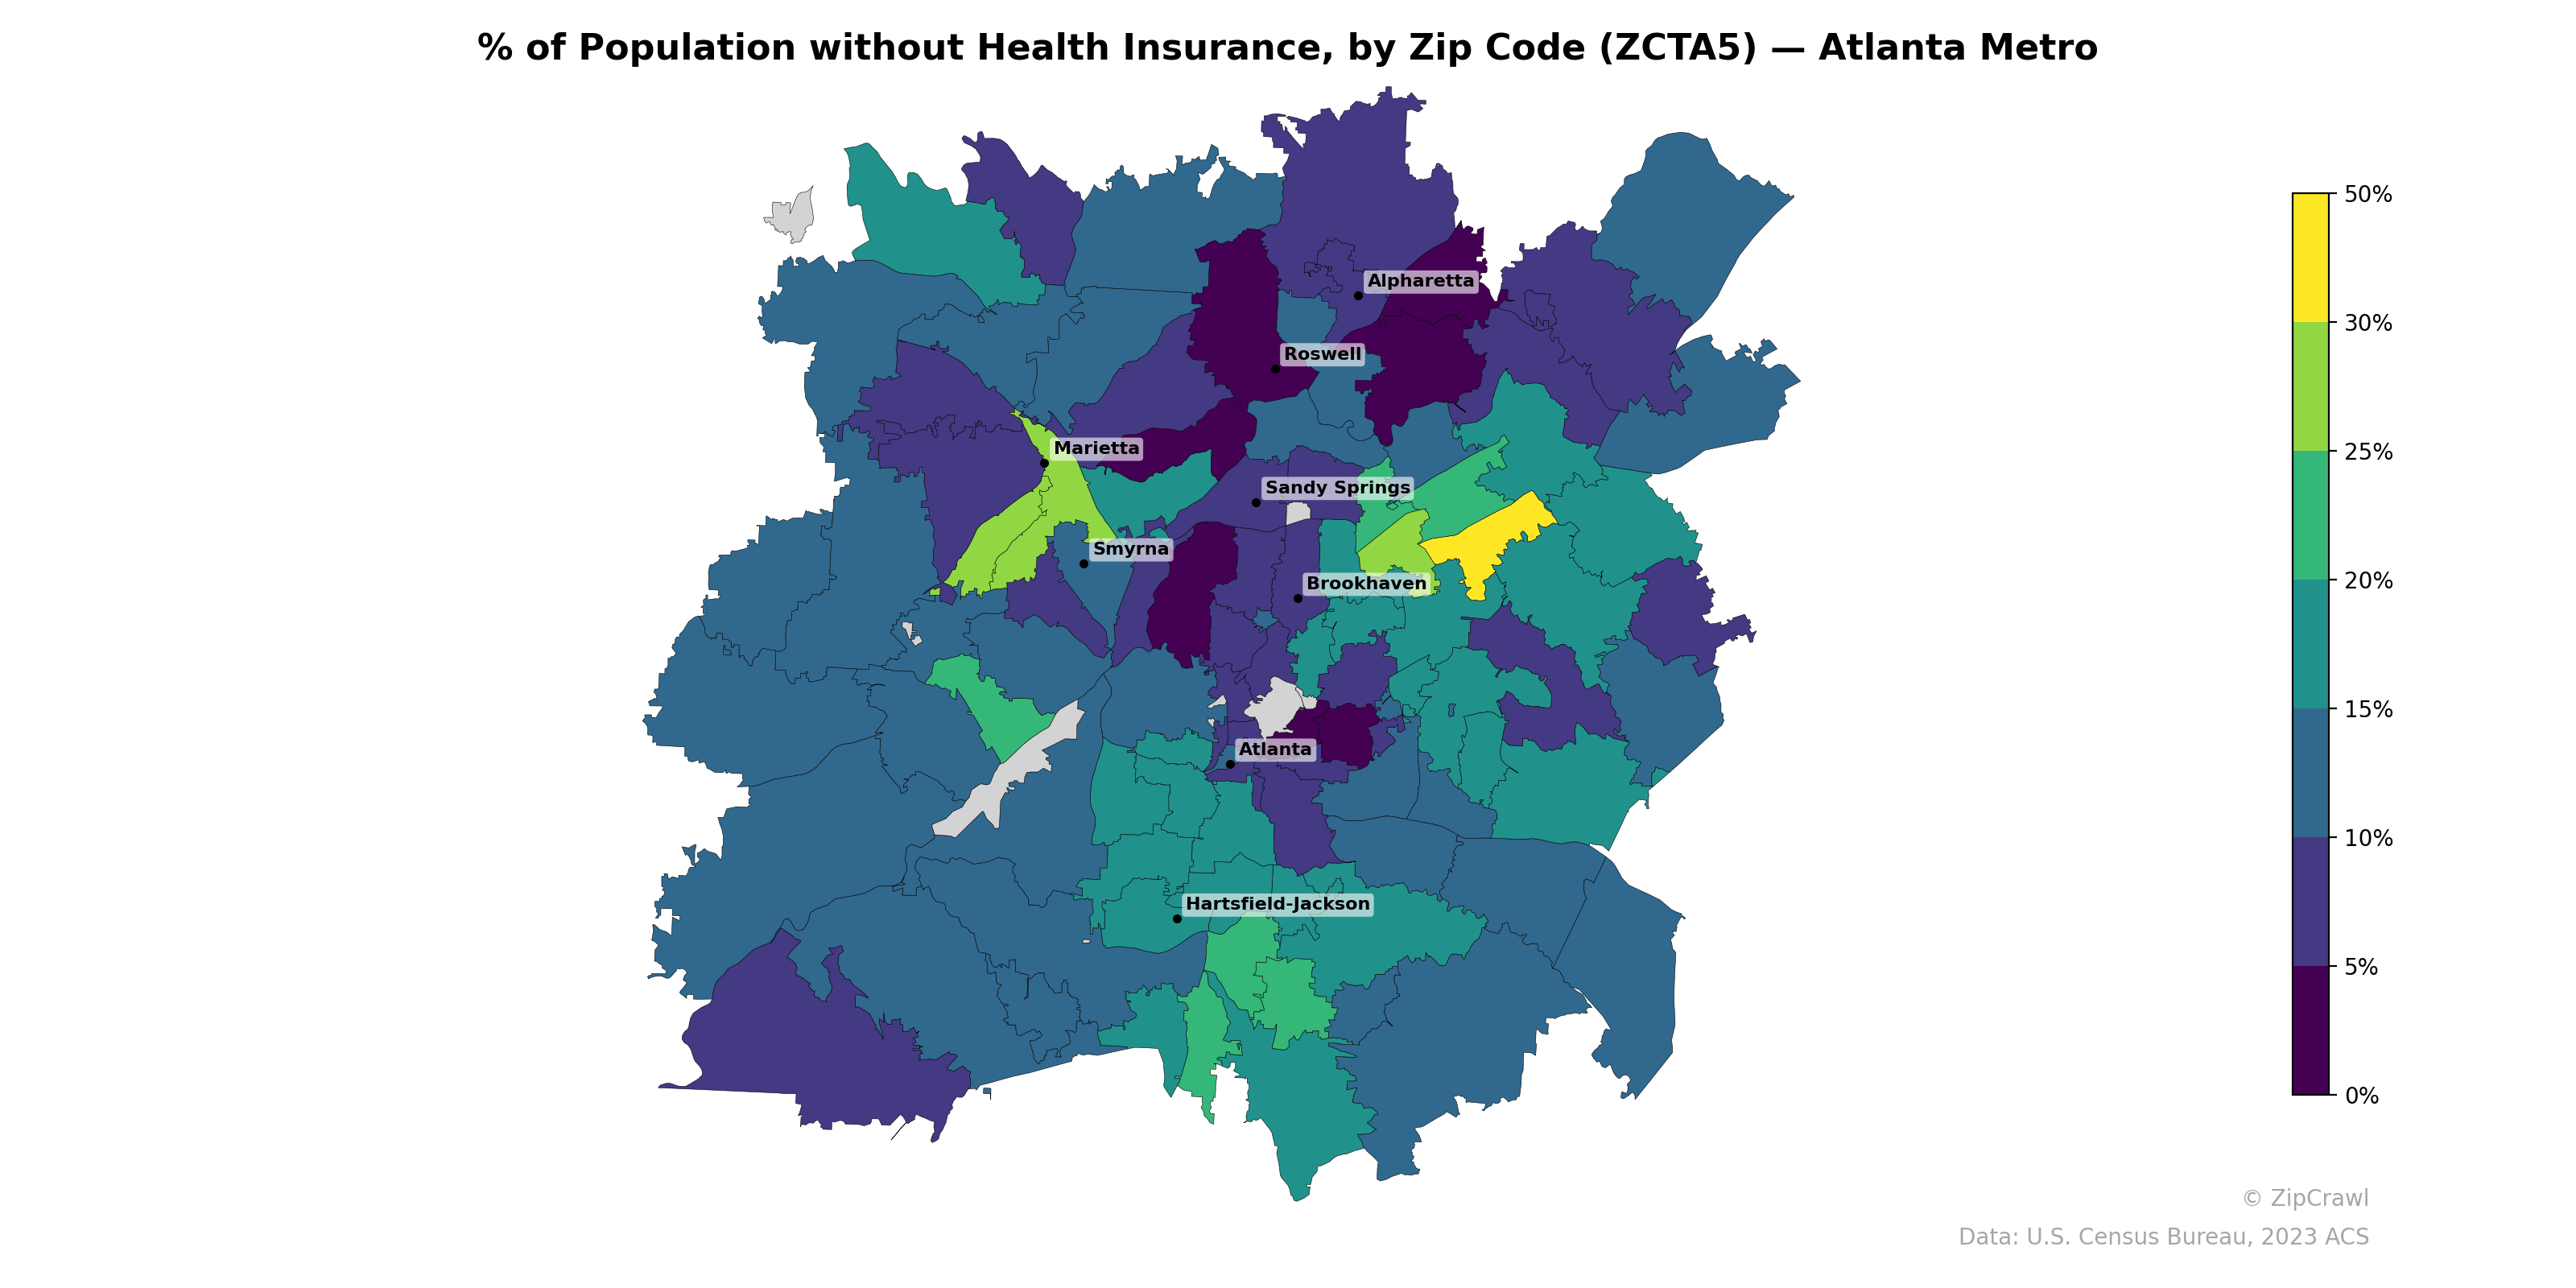
Uninsured rates in the Atlanta metro area exhibit a stark spatial gradient, with the highest concentrations (30–50%) clustered in zip codes northeast of Sandy Springs near Brookhaven and in portions of Marietta, likely reflecting areas with larger immigrant and non-citizen populations. In contrast, much of the southern and outer suburban periphery, along with affluent north-side communities near Alpharetta and Roswell, reports substantially lower uninsured rates in the 5–15% range. The core of Atlanta itself displays a patchwork pattern, with some downtown-adjacent zip codes showing very low uninsured percentages while neighboring areas climb above 15–20%, underscoring the hyperlocal nature of insurance coverage disparities.
Data: U.S. Census Bureau, 2023 ACS
Explore
- Population Non-Hispanic Asian % by Zip Code (ZCTA5) — New York Metro
- Married Couple (% of all Households) by Zip Code (ZCTA5) — Atlanta Metro
- Household Average Size by Zip Code (ZCTA5) — Atlanta Metro
- Housing % of Units Built Since 2010, by Zip Code (ZCTA5) — Atlanta Metro
- Bachelor's Degree or Higher (% of Over 25) by Zip Code (ZCTA5) — Atlanta Metro
- Housing Owner-Occupied % of Units, by Zip Code (ZCTA5) — Atlanta Metro
- Housing Owner-Occupied Median Value ($), by Zip Code (ZCTA5) — Atlanta Metro
- Housing Vacancy Rate by Zip Code (ZCTA5) — Atlanta Metro
- % of Households with Broadband Internet, by Zip Code (ZCTA5) — Atlanta Metro
- Housing Median Monthly Rent ($), by Zip Code (ZCTA5) — Atlanta Metro
- Population Non-Hispanic Asian % by Zip Code (ZCTA5) — Idaho
- Population Non-Hispanic White % by County
- Household Average Size by Zip Code (ZCTA5) — New York Metro
- Housing Owner-Occupied Median Value ($), by Zip Code (ZCTA5) — New York Metro
- % of Households with Broadband Internet, by Zip Code (ZCTA5) — New York Metro
- Housing % of Units Built Since 2010, by Zip Code (ZCTA5) — New York Metro
- Housing Vacancy Rate by Zip Code (ZCTA5) — New York Metro
- Housing Median Monthly Rent ($), by Zip Code (ZCTA5) — New York Metro
- Married Couple (% of all Households) by Zip Code (ZCTA5) — New York Metro
- Population Non-Hispanic Asian % by Zip Code (ZCTA5) — North Carolina
- Married Couple (% of all Households) by Zip Code (ZCTA5) — North Carolina
- % of Population on Food Stamps or SNAP (Last 12 Months), by Zip Code (ZCTA5) — North Carolina
- % of Households with Broadband Internet, by Zip Code (ZCTA5) — North Carolina
- Housing Owner-Occupied Median Value ($), by Zip Code (ZCTA5) — North Carolina
- High School Graduate (% of Over 25) by Zip Code (ZCTA5) — North Carolina
- Housing Owner-Occupied % of Units, by Zip Code (ZCTA5) — North Carolina
- Housing % of Units Built Since 2010, by Zip Code (ZCTA5) — North Carolina
- Household Average Size by Zip Code (ZCTA5) — North Carolina
- Housing Vacancy Rate by Zip Code (ZCTA5) — North Carolina
- Bachelor's Degree or Higher (% of Over 25) by Zip Code (ZCTA5) — North Carolina
- % of Population without Health Insurance, by Zip Code (ZCTA5) — Portland Metro
- % of Population without Health Insurance, by Zip Code (ZCTA5) — Austin Metro
- % of Population without Health Insurance, by Zip Code (ZCTA5) — Orlando Metro
- % of Population without Health Insurance, by Zip Code (ZCTA5) — Boston Metro
- % of Population without Health Insurance, by Zip Code (ZCTA5) — Houston Metro
- % of Population without Health Insurance, by Zip Code (ZCTA5) — Miami Metro
- % of Population without Health Insurance, by Zip Code (ZCTA5) — Detroit Metro
- % of Population without Health Insurance, by Zip Code (ZCTA5) — Tampa Metro
- % of Population without Health Insurance, by Zip Code (ZCTA5) — Chicago Metro
- % of Population without Health Insurance, by Zip Code (ZCTA5) — Phoenix Metro