NOTE: Gray indicates insufficient data or a suppressed estimate.
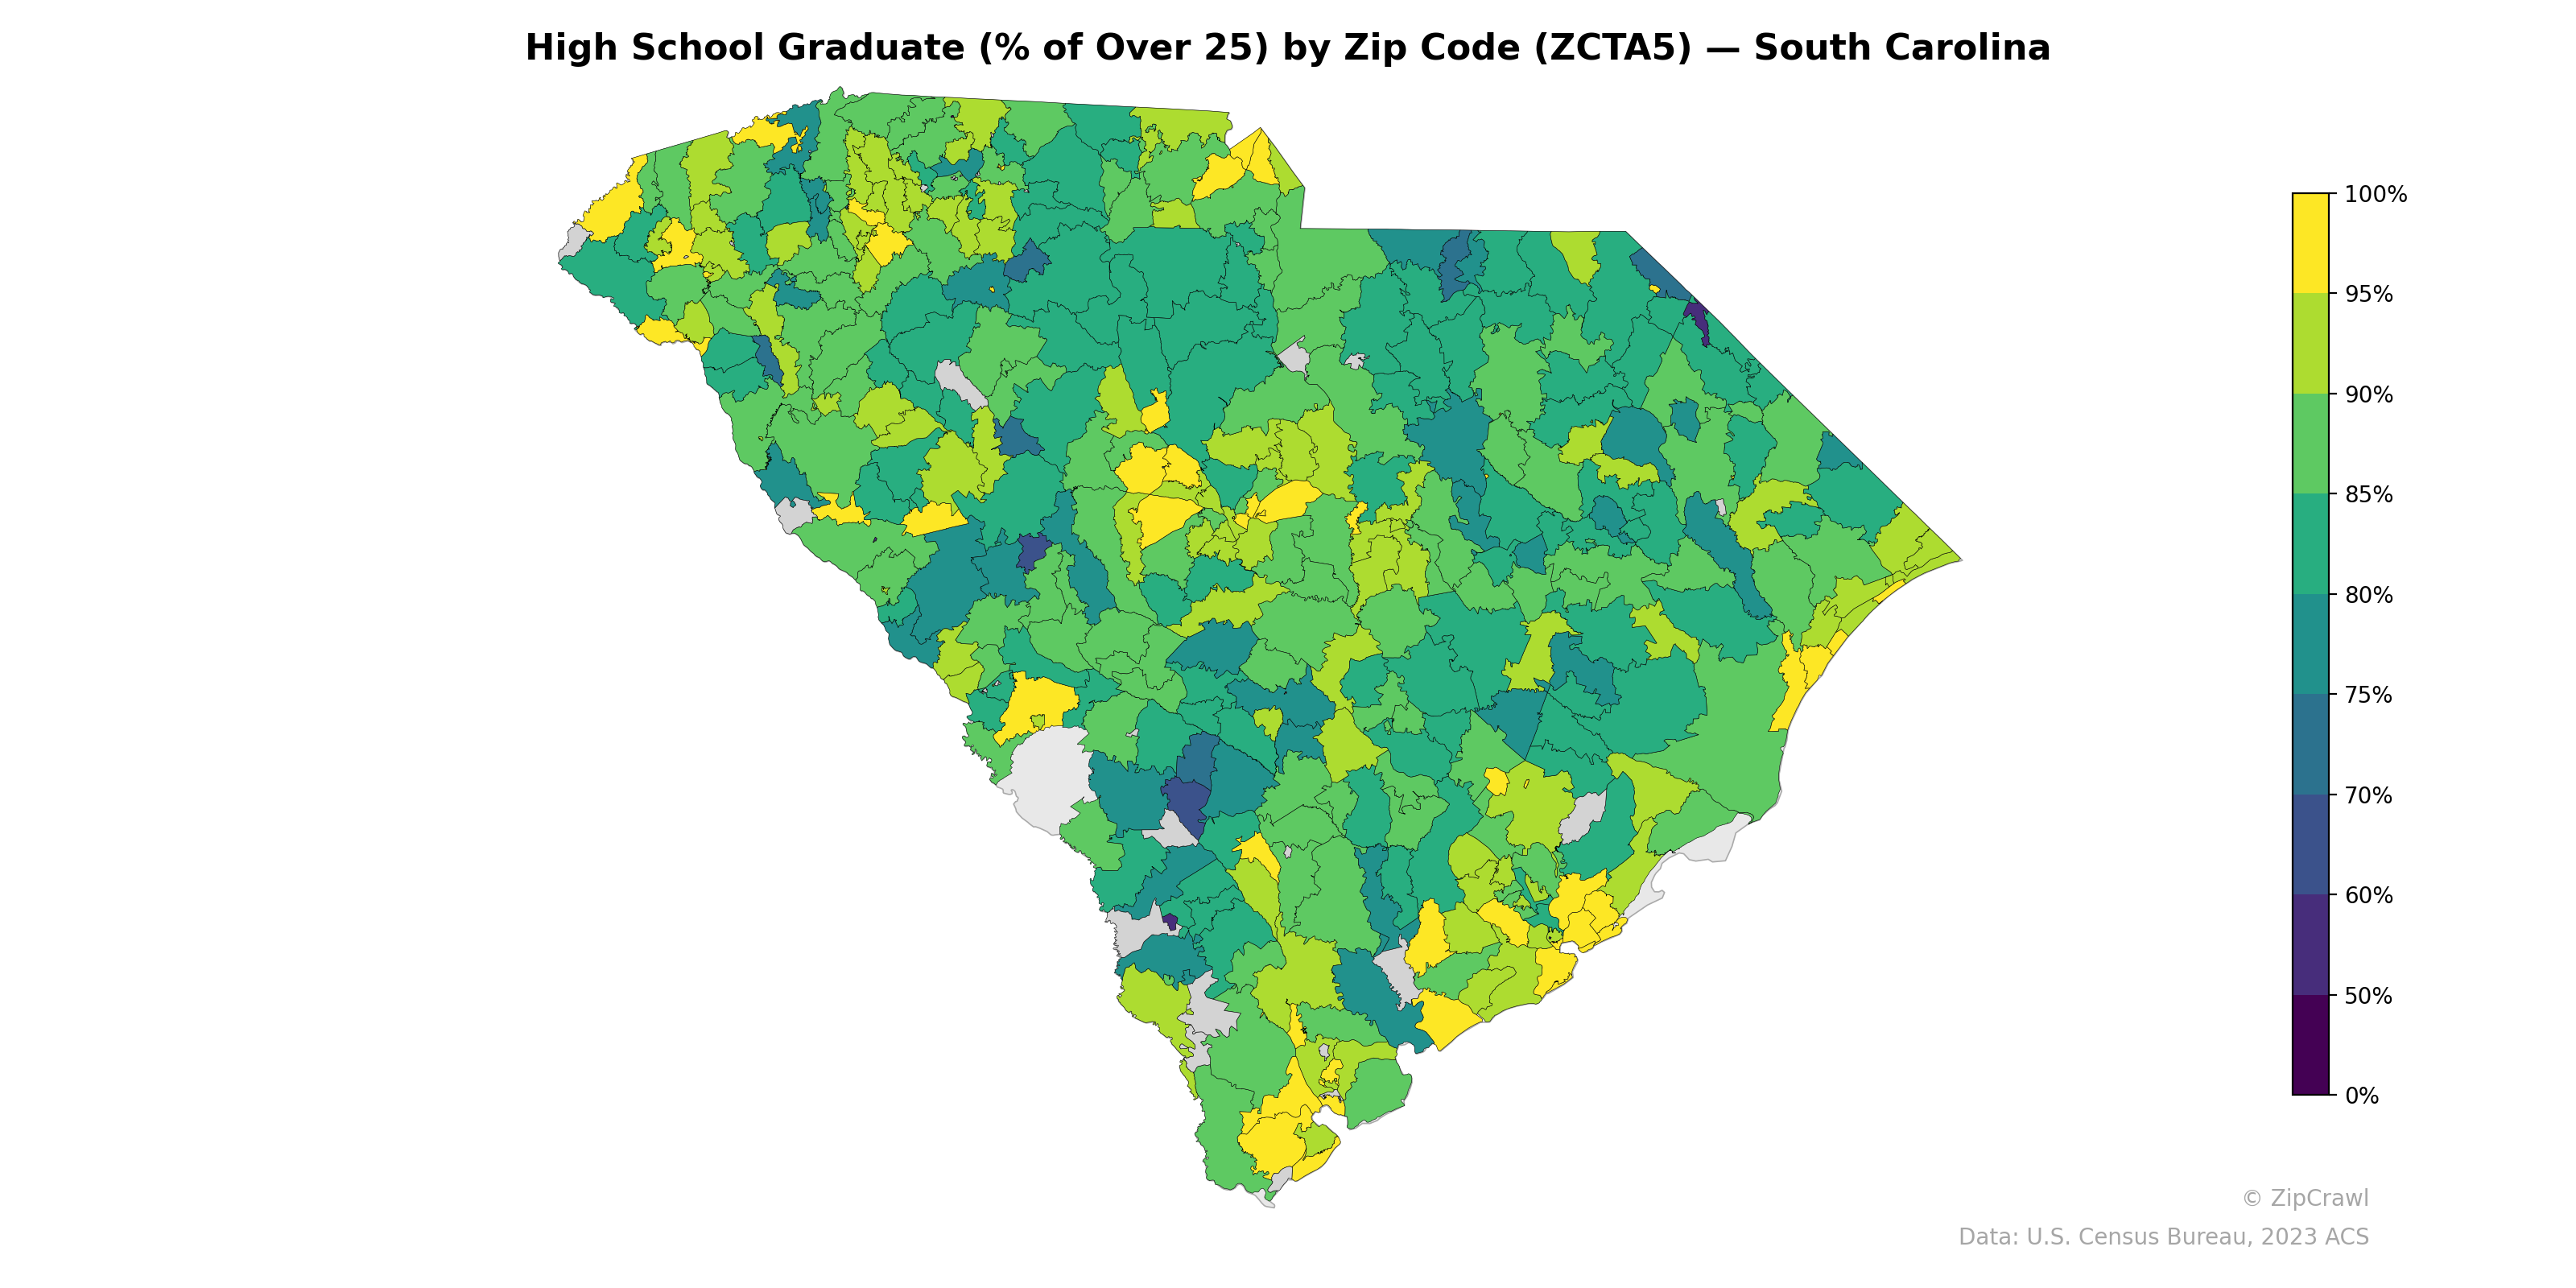
High school graduation rates across South Carolina zip codes generally range from 70% to 95%, with notable clusters of higher attainment (90%+) in the upstate region around Greenville-Spartanburg, suburban areas near Charleston, and coastal communities along Hilton Head and Myrtle Beach. The lowest graduation rates, dipping below 70%, concentrate in rural zip codes across the central Midlands and Pee Dee regions, as well as parts of the rural Lowcountry, reflecting persistent educational disparities in historically underserved corridors. A clear suburban-rural divide is evident, with zip codes surrounding metropolitan cores like Columbia, Charleston, and Greenville showing markedly higher attainment than their surrounding rural counterparts.
Data: U.S. Census Bureau, 2023 ACS
Explore
- Housing Owner-Occupied Median Value ($), by Zip Code (ZCTA5) — Texas
- Population Non-Hispanic American Indian % by Zip Code (ZCTA5) — South Carolina
- Housing Owner-Occupied Median Value ($), by Zip Code (ZCTA5) — South Carolina
- % of Households with Broadband Internet, by Zip Code (ZCTA5) — South Carolina
- Housing Owner-Occupied % of Units, by Zip Code (ZCTA5) — South Carolina
- Household Average Size by Zip Code (ZCTA5) — South Carolina
- Bachelor's Degree or Higher (% of Over 25) by Zip Code (ZCTA5) — South Carolina
- % of Population without Health Insurance, by Zip Code (ZCTA5) — South Carolina
- Housing Median Monthly Rent ($), by Zip Code (ZCTA5) — South Carolina
- Housing % of Units Built Since 2010, by Zip Code (ZCTA5) — South Carolina
- Bachelor's Degree or Higher (% of Over 25) by County
- % of Population without Health Insurance, by Zip Code (ZCTA5) — Texas
- Housing % of Units Built Since 2010, by Zip Code (ZCTA5) — Texas
- Married Couple (% of all Households) by Zip Code (ZCTA5) — Texas
- Household Average Size by Zip Code (ZCTA5) — Texas
- Housing Owner-Occupied % of Units, by Zip Code (ZCTA5) — Texas
- Housing Median Monthly Rent ($), by Zip Code (ZCTA5) — Texas
- Housing Vacancy Rate by Zip Code (ZCTA5) — Texas
- % of Households with Broadband Internet, by Zip Code (ZCTA5) — Texas
- Bachelor's Degree or Higher (% of Over 25) by Zip Code (ZCTA5) — Texas
- Bachelor's Degree or Higher (% of Over 25) by Zip Code (ZCTA5) — Wisconsin
- % of Population on Food Stamps or SNAP (Last 12 Months), by Zip Code (ZCTA5) — Wisconsin
- Population Non-Hispanic Black % by Zip Code (ZCTA5) — Wisconsin
- Population Non-Hispanic White % by Zip Code (ZCTA5) — Wisconsin
- U.S. Citizens (% of Population Over 18) by Zip Code (ZCTA5) — Colorado
- Population Non-Hispanic American Indian % by Zip Code (ZCTA5) — Wisconsin
- Household Average Size by Zip Code (ZCTA5) — Wisconsin
- Median Age by Zip Code (ZCTA5) — Wisconsin
- Married Couple (% of all Households) by Zip Code (ZCTA5) — Wisconsin
- Population Hispanic % by Zip Code (ZCTA5) — Wisconsin
- High School Graduate (% of Over 25) by Zip Code (ZCTA5) — North Carolina
- High School Graduate (% of Over 25) by Zip Code (ZCTA5) — South Dakota
- High School Graduate (% of Over 25) by Zip Code (ZCTA5) — Ohio
- High School Graduate (% of Over 25) by Zip Code (ZCTA5) — Utah
- High School Graduate (% of Over 25) by Zip Code (ZCTA5) — Iowa
- High School Graduate (% of Over 25) by Zip Code (ZCTA5) — Indiana
- High School Graduate (% of Over 25) by Zip Code (ZCTA5) — Montana
- High School Graduate (% of Over 25) by Zip Code (ZCTA5) — Arizona
- High School Graduate (% of Over 25) by Zip Code (ZCTA5) — Colorado
- High School Graduate (% of Over 25) by Zip Code (ZCTA5) — Texas