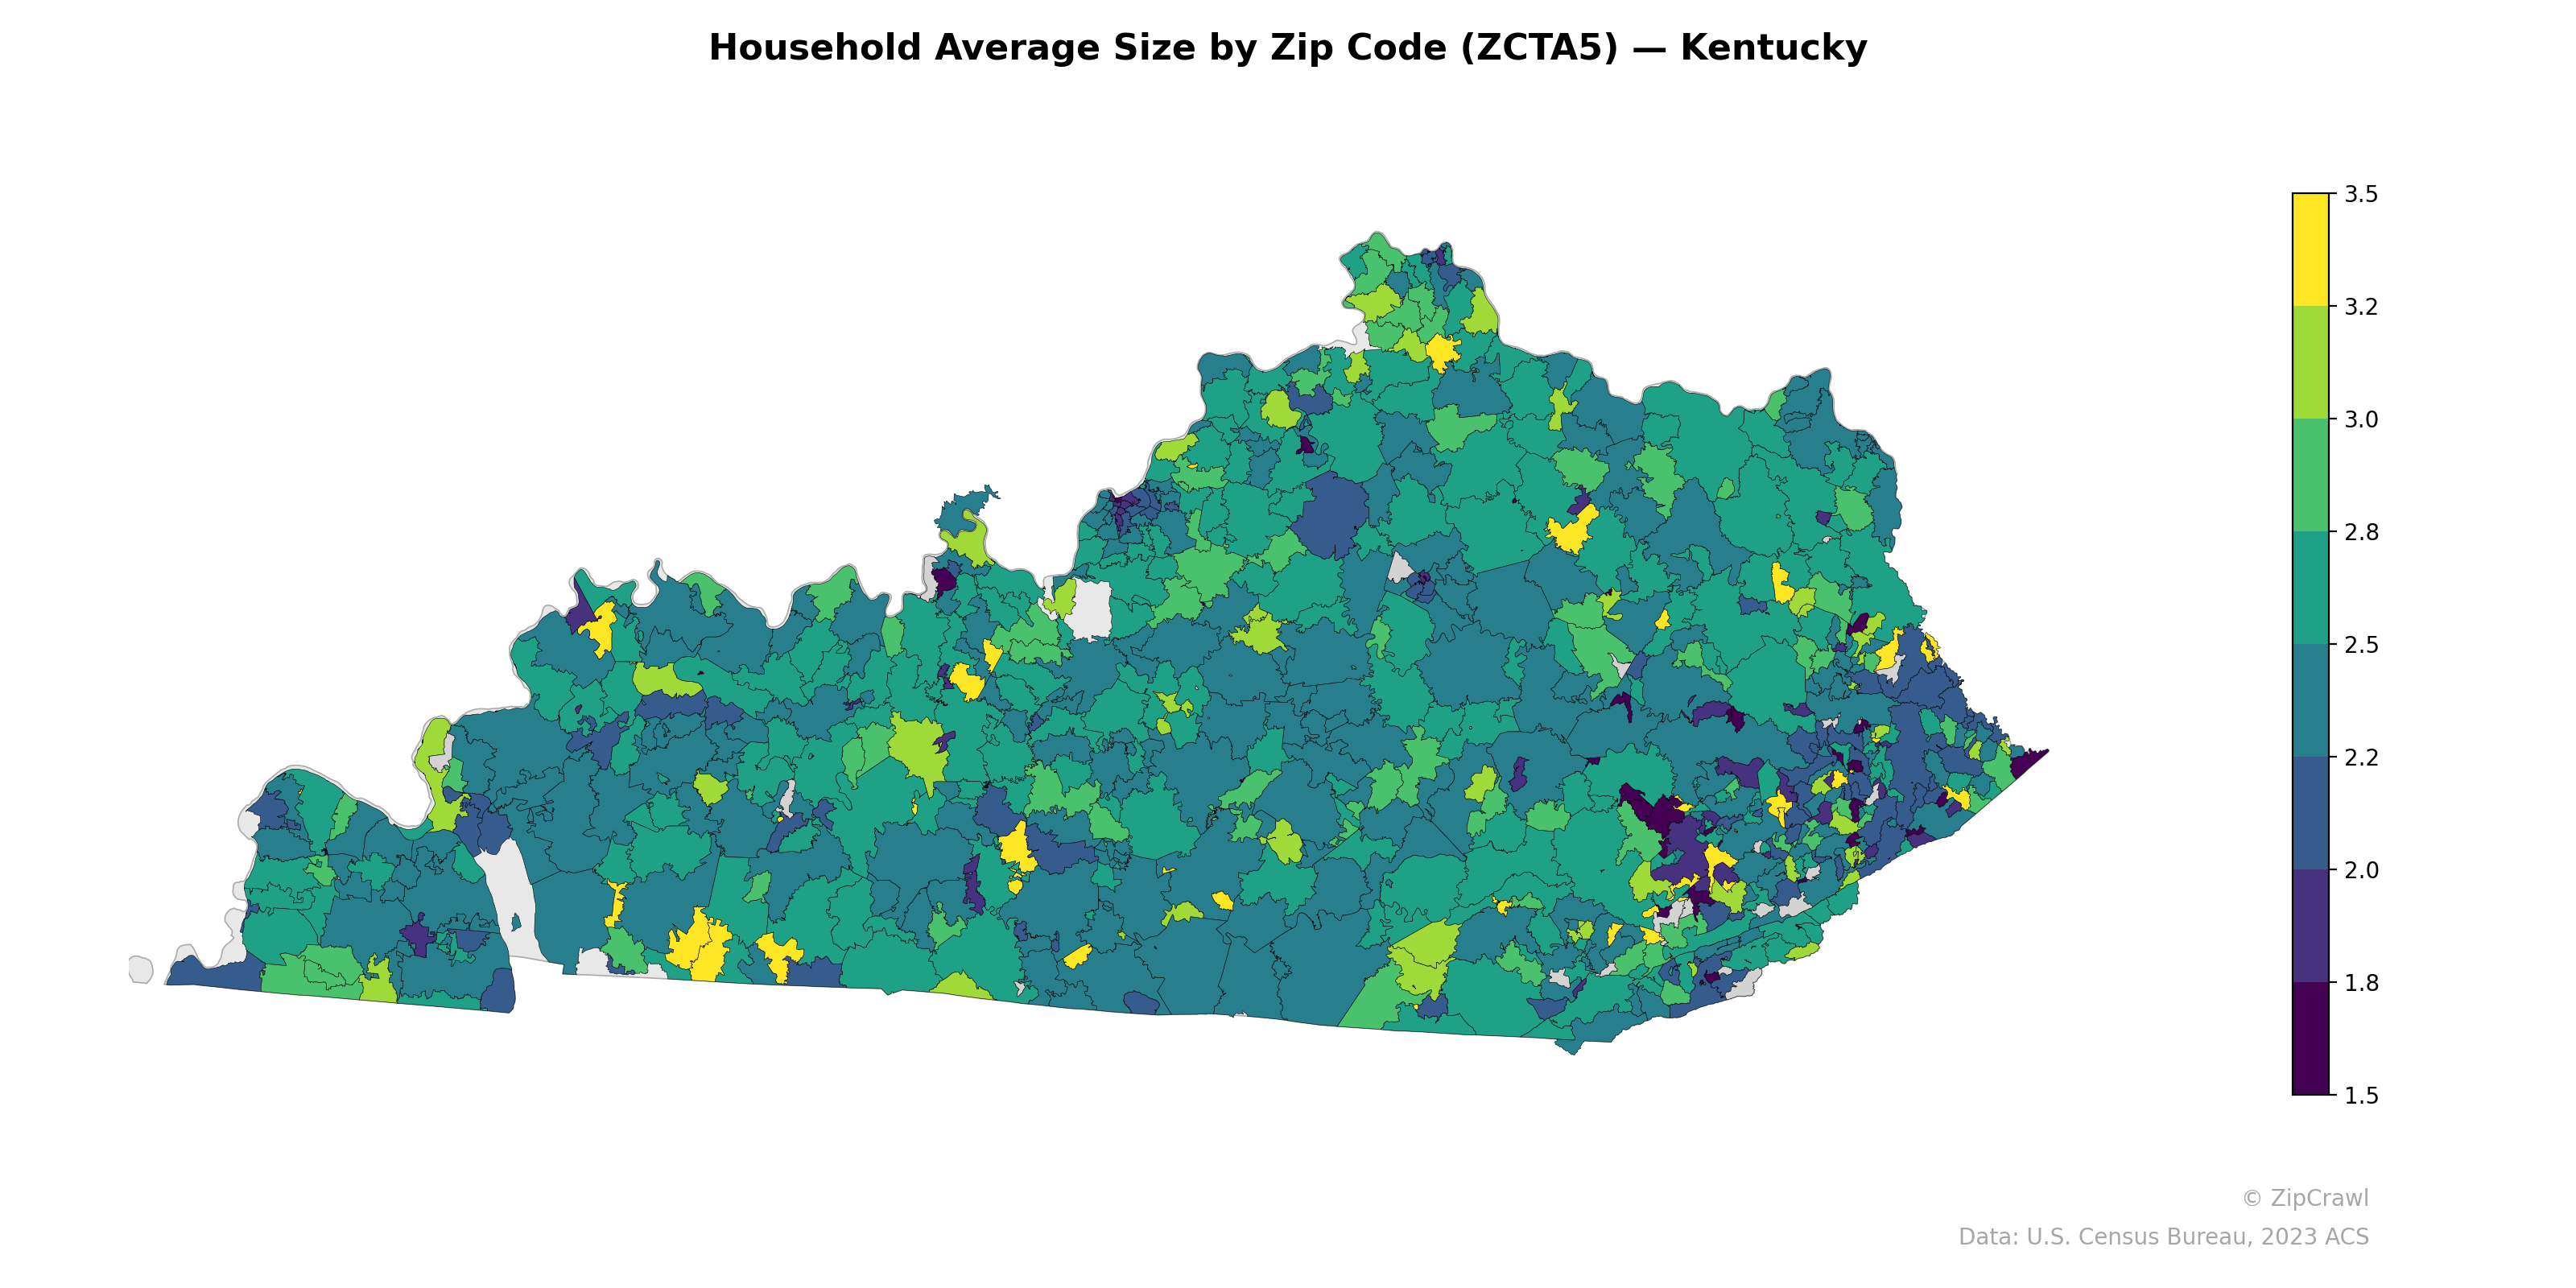
NOTE: Gray indicates insufficient data or a suppressed estimate.
Household sizes in Kentucky tend to be largest in the rural western portion of the state and in scattered suburban zip codes ringing Louisville and the northern Kentucky/Cincinnati metro fringe, where several ZCTAs reach 3.0 or above. The smallest average household sizes—dropping to 1.5–1.8—cluster in eastern Kentucky's Appalachian coalfield communities and in urban cores such as Lexington and Louisville, likely reflecting higher concentrations of single-person households and aging populations. A broad central swath of the state hovers near the statewide median around 2.3–2.5, with pockets of notably higher values appearing in southeastern Kentucky, possibly tied to larger family structures in specific rural communities.
Data: U.S. Census Bureau, 2023 ACS
Explore
- Median Age by Zip Code (ZCTA5) — California
- High School Graduate (% of Over 25) by Zip Code (ZCTA5) — Kentucky
- Housing Owner-Occupied Median Value ($), by Zip Code (ZCTA5) — Kentucky
- Population Non-Hispanic American Indian % by Zip Code (ZCTA5) — Kentucky
- Housing Median Monthly Rent ($), by Zip Code (ZCTA5) — Kentucky
- Housing % of Units Built Since 2010, by Zip Code (ZCTA5) — Kentucky
- % of Households with Broadband Internet, by Zip Code (ZCTA5) — Kentucky
- Bachelor's Degree or Higher (% of Over 25) by Zip Code (ZCTA5) — Kentucky
- Housing Owner-Occupied % of Units, by Zip Code (ZCTA5) — Kentucky
- % of Population without Health Insurance, by Zip Code (ZCTA5) — Kentucky
- % of Households with Broadband Internet, by County
- Population Non-Hispanic American Indian % by Zip Code (ZCTA5) — California
- Population Non-Hispanic Black % by Zip Code (ZCTA5) — California
- Population Non-Hispanic White % by Zip Code (ZCTA5) — California
- Population Hispanic % by Zip Code (ZCTA5) — California
- Household Median Income by Zip Code (ZCTA5) — California
- U.S. Citizens (% of Population Over 18) by Zip Code (ZCTA5) — California
- % of Population on Food Stamps or SNAP (Last 12 Months), by Zip Code (ZCTA5) — Texas
- Population Non-Hispanic Asian % by Zip Code (ZCTA5) — Texas
- High School Graduate (% of Over 25) by Zip Code (ZCTA5) — California
- High School Graduate (% of Over 25) by Zip Code (ZCTA5) — New York
- Housing Median Monthly Rent ($), by Zip Code (ZCTA5) — Alabama
- Housing Owner-Occupied Median Value ($), by Zip Code (ZCTA5) — Alabama
- Housing % of Units Built Since 2010, by Zip Code (ZCTA5) — Alabama
- % of Households with Broadband Internet, by Zip Code (ZCTA5) — Alabama
- Married Couple (% of all Households) by Zip Code (ZCTA5) — Alabama
- Population Hispanic % by Zip Code (ZCTA5) — Louisiana
- Housing Owner-Occupied % of Units, by Zip Code (ZCTA5) — Alabama
- Population Non-Hispanic Asian % by Zip Code (ZCTA5) — Alabama
- % of Population without Health Insurance, by Zip Code (ZCTA5) — Alabama
- Household Average Size by Zip Code (ZCTA5) — Kansas
- Household Average Size by Zip Code (ZCTA5) — Iowa
- Household Average Size by Zip Code (ZCTA5) — Ohio
- Household Average Size by Zip Code (ZCTA5) — Utah
- Household Average Size by Zip Code (ZCTA5) — Maine
- Household Average Size by Zip Code (ZCTA5) — Alaska
- Household Average Size by Zip Code (ZCTA5) — Idaho
- Household Average Size by Zip Code (ZCTA5) — Texas
- Household Average Size by Zip Code (ZCTA5) — Hawaii
- Household Average Size by Zip Code (ZCTA5) — Oregon